COVID-19 Data & Docs

Moderators: Elvis, DrVolin, Jeff

Re: COVID-19 Data & Docs

Postby alloneword » Tue Apr 07, 2020 10:38 am


'Corrected' data here: https://www.ons.gov.uk/file?uri=%2fpeop ... 32020.xlsx

(..this time without the extra 100,000 'covid' deaths under the 'places' tab!)

UK deaths by age group.png
You do not have the required permissions to view the files attached to this post.
User avatar
alloneword
 
Posts: 902
Joined: Mon Jan 22, 2007 9:19 am
Location: UK
Blog: View Blog (0)

Re: COVID-19 Data & Docs

Postby alloneword » Tue Apr 07, 2020 11:09 am

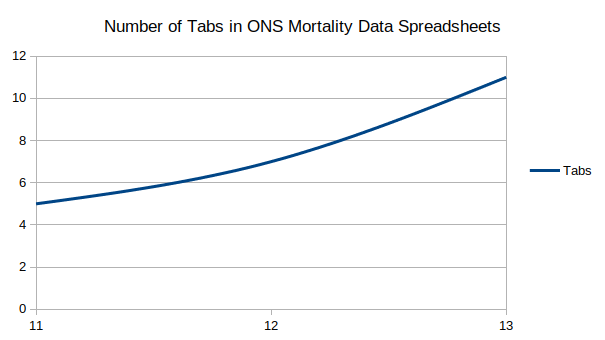
I'm seeing a worrying trend regarding the number of tabs on ONS mortality data spreadsheets.

A mere two weeks ago, they looked like this:

Image

Today it's grown to this:

Image

To get an idea of the scale of the problem, we can visualise it thus:

Image

My extensive modelling (using six undocumented lines of Haskell and a sharpened stick) of the above data leads me to believe that, should this trend continue, I will run out of screen space sometime in May and will probably have to <shift> scroll to keep up.

Unchecked, my model predicts that they will have used up the entire global supply of tabs before Christmas.
User avatar
alloneword
 
Posts: 902
Joined: Mon Jan 22, 2007 9:19 am
Location: UK
Blog: View Blog (0)

Re: COVID-19 Data & Docs

Postby alloneword » Tue Apr 07, 2020 11:34 am

An interesting article on the Management of Risk:

https://science20.org/david-zaruk/20200 ... ur-ability

Two decades of the precautionary principle as the key policy tool for managing uncertainties has neutered risk management capacities by offering, as the only approach, the systematic removal of any exposure to any hazard. As the risk-averse precautionary mindset cements itself, more and more of us have become passive docilians waiting to be nannied. We no longer trust and are no longer trusted with risk-benefit choices as we are channelled down over-engineered preventative paths. While it is important to reduce exposure to risks, our excessively-protective risk managers have, in their zeal, removed our capacity to manage risks ourselves. Precaution over information, safety over autonomy, dictation over accountability.


A lot to disagree with in the article, but a lot that needs saying.
User avatar
alloneword
 
Posts: 902
Joined: Mon Jan 22, 2007 9:19 am
Location: UK
Blog: View Blog (0)

Re: COVID-19 Data & Docs

Postby alloneword » Tue Apr 07, 2020 11:49 am

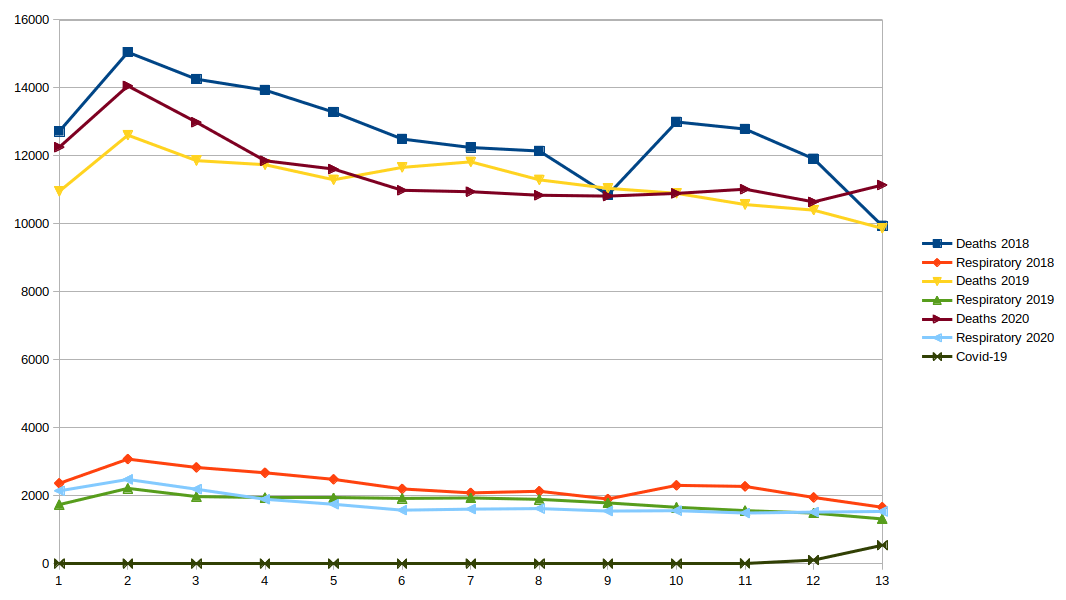
Latest ONS data plotted:

Image
User avatar
alloneword
 
Posts: 902
Joined: Mon Jan 22, 2007 9:19 am
Location: UK
Blog: View Blog (0)

Re: COVID-19 Data & Docs

Postby alloneword » Tue Apr 07, 2020 3:51 pm

A really, really good indepth article on 'testing':

And data on tests and the number of reported cases is highly nonrandom. In many parts of the world today, health authorities are still trying to triage the situation with a limited number of tests available. Their goal in testing is often to allocate scarce medical care to the patients who most need it — rather than to create a comprehensive dataset for epidemiologists and statisticians to study.

But if you’re not accounting for testing patterns, it can throw your conclusions entirely out of whack. You don’t just run the risk of being a little bit wrong: Your analysis could be off by an order of magnitude. Or even worse, you might be led in the opposite direction of what is actually happening. A country where the case count is increasing because it’s doing more testing, for instance, might actually be getting its epidemic under control. Alternatively, in a country where the reported number of new cases is declining, the situation could actually be getting worse, either because its system is too overwhelmed to do adequate testing or because it’s ramping down on testing for PR reasons.


https://fivethirtyeight.com/features/co ... aningless/
User avatar
alloneword
 
Posts: 902
Joined: Mon Jan 22, 2007 9:19 am
Location: UK
Blog: View Blog (0)

Re: COVID-19 Data & Docs

Postby alloneword » Wed Apr 08, 2020 3:44 pm

A couple of pieces on Sweden. The first from last week:

As in Britain and the US, many scientists have appealed to the government to close schools and impose curfews. Unlike in Britain and the US, the authorities have calmly responded by explaining how this wouldn’t really help. They publish their own models of the virus spread. It shows how many people will need hospital care: the system, they say, can cope. And when asked, they say they don’t think Imperial College has made a better call.

Perhaps Tegnell and his team will turn out to be wrong. But their point is that the people deserve policies that work for longer than a month. Managing the virus is a long game, and while herd immunity is not the Swedish strategy, it may well be where we all end up. The theory of lockdown, after all, is pretty niche, deeply illiberal — and, until now, untested. It’s not Sweden that’s conducting a mass experiment. It’s everyone else.

https://spectator.us/lockdown-please-swedish/

And a second from a couple of days ago:

Lots of people are rushing to discredit Sweden’s approach, which relies more on calibrated precautions and isolating only the most vulnerable than on imposing a full lockdown. While gatherings of more than 50 people are prohibited and high schools and colleges are closed, Sweden has kept its borders open as well as its preschools, grade schools, bars, restaurants, parks, and shops.

President Trump has no use for Sweden’s nuanced approach. Last Wednesday, he smeared it in a spectacular fashion by saying he’d heard that Sweden “gave it a shot, and they saw things that were really frightening, and they went immediately to shutting down the country.” He and the public-health experts who told him this were wrong on both counts and would do better to question their approach.

[...]

This is, in fact, the first time we have quarantined healthy people rather than quarantining the sick and vulnerable.

[...]

We’ve posed these simple questions to many highly trained infectious-disease doctors, epidemiologists, mathematical disease-modelers, and other smart, educated professionals. It turns out that, while you need proof beyond a reasonable doubt to convict a person of theft and throw them in jail, you don’t need any actual evidence (much less proof) to put millions of people into a highly invasive and burdensome lockdown with no end in sight and nothing to prevent the lockdown from being reimposed at the whim of public-health officials. Is this rational?

https://www.nationalreview.com/2020/04/ ... omic-ruin/
User avatar
alloneword
 
Posts: 902
Joined: Mon Jan 22, 2007 9:19 am
Location: UK
Blog: View Blog (0)

Re: COVID-19 Data & Docs

Postby alloneword » Fri Apr 10, 2020 7:31 am

I was looking at ways to communicate a sense of the scale of this problem, in terms of overall effect on global population numbers.

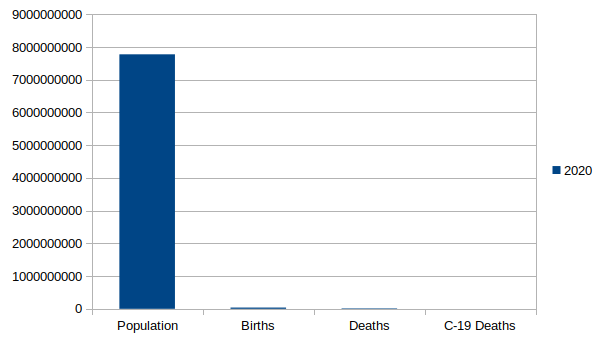
First, I looked at a linear graph...

Image

But clearly, it tells us nothing, as the Covid-19 deaths don't show up at all.

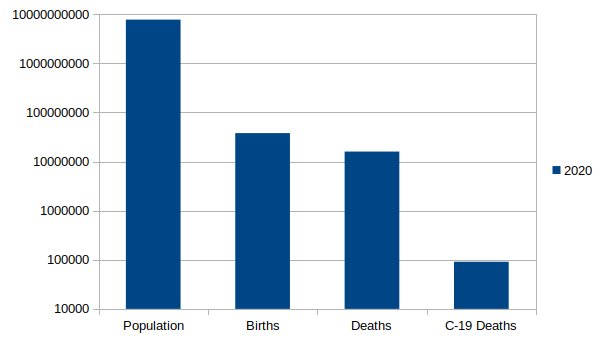
So maybe a logarithmic graph?

Image

Sure, they show up, but people don't instinctively understand what they're looking at.

In the end, I settled on the 'longcats' linear style - (image edited to link, so as to not break the thread):

https://i.postimg.cc/66Jtdj7Q/World-pop ... in-10k.png

That's as short as I can make it and still have the c-19 bar visible, but unfortunately I had to reduce it to 10,000 pixels in height for the image hosting, so the resolution has suffered a bit, but if you look really hard, you can see the c-19 bar.

I have to ask myself how many of the people represented in the 'total population' bar are going to suffer (and possible die) as a result of halting the entire World economy (with the possible exception of Sweden)?

It's a question that a few are now starting to ask:

https://www.theguardian.com/global-deve ... al-poverty

https://www.bbc.com/news/business-52236936

https://www.wider.unu.edu/news/press-re ... -countries

https://www.wider.unu.edu/publication/e ... al-poverty
User avatar
alloneword
 
Posts: 902
Joined: Mon Jan 22, 2007 9:19 am
Location: UK
Blog: View Blog (0)

Re: COVID-19 Data & Docs

Postby alloneword » Fri Apr 10, 2020 2:21 pm

^^ As I was saying (This is paywalled, so dumped in full):

https://www.telegraph.co.uk/politics/20 ... r-can-end/

Boris is worried lockdown has gone too far, but only he can end it

Fraser Nelson April 09, 2020

At the end of last week, the Prime Minister was beginning to wonder if the country was taking his advice too much to heart. He asked us to stay at home - and we have. At each daily press conference, medical and scientific advisers talk about the plunge in use of transport and how well rules are being observed. What they don’t say is that this was not quite in their original plan. Government modellers didn’t expect such obedience: the expected workers to carry on and at least a million pupils to be left in school by parents.

The deaths caused by Covid-19 – up another 881 today – are shocking. But so, too, are the effects of the lockdown. “Our message was supposed to be: keep working, but work from home if possible,” says one minister. “But that message has got lost.” The Treasury expected three million claimants for its “job retention” scheme. Nine million are now expected. The plan was for about one in five school pupils to stay in class: not just the children of key workers, but those regarded as vulnerable or with special needs. Instead, it seems, just 2 per cent of pupils turned up.

This was troubling Boris Johnson during his initial Covid self-confinement. He’d started to discuss this with colleagues. Had they overdone the message? The stay-at-home exhortations were issued with such vigour because it was assumed - wrongly - that Brits would not really listen. Instead, we’ve become as obedient as Swedes while the Swedes - in their collective refusal to lock down - are behaving like Brits. But it’s hard to soften the lockdown message with the Prime Minister, the main messenger, out of intensive care - but, until he fully recovers, out of action.

Other options are, now, being discussed. Perhaps adverts, politely telling us that our country needs us to work. (As one minister puts it: “somebody has to pay for the NHS”). Parents, too, might be urged to send their children to school after Easter – if they qualify. But it’s easy to see how employers, workers and parents have gone to ground. “Stay at home, Protect the NHS, Save lives” – a message honed by Isaac Levido, the Tory election campaign chief – has worked. All too well.

Matt Hancock, the Health Secretary, had been working with the Prime Minister on the next step: how to stop the end of lockdown being seen as a question of “lives vs money”. As a former economic adviser, Hancock is certainly mindful of the money: a £200 billion deficit could mean another decade of austerity. But other figures – infections, mortality rates and deaths – are rightly holding the national attention. Phasing out the lockdown needs to be spoken about in terms of lives vs lives. Or, crudely, whether lockdown might end up costing more lives than the virus.

Chris Whitty, the chief medical officer, has worried about this from the offset. In meetings he often stresses that a pandemic kills people directly, and indirectly. A smaller economy means a poorer society and less money for the NHS – eventually. But right now, he says, there will be parents avoiding the NHS, not vaccinating their children – so old diseases return. People who feel a lump now may not get it checked out. Cancer treatment is curtailed. Therapy is abandoned.

Work is being done to add it all up and produce a figure for “avoidable deaths” that could, in the long-term, be caused by lockdown. I’m told the early attempts have produced a figure of 150,000, far greater than those expected to die of Covid.

This is, of course, a model – just like the model for Covid deaths produced by Imperial College. But estimates of lockdown victims are being shared among those in government who worry about the social damage now underway: the domestic violence, the depression, even suicides accompanying the mass bankruptcies. But these are deaths that may, or may not, show up in national figures in a year’s time. It’s hard to weigh them up against a virus whose victims are being counted every day.

The Cabinet, now, is split into three groups. Some think still the lockdown is, if anything, too lax. (One minister has even proposed adopting a French-style system, demanding that no one steps outside without papers authorising them to do so.) Then we have those who think the cure is already worse than the disease and want to phase out lockdown at the earliest opportunity. Then a third group, who think it doesn’t matter what government thinks. Public opinion, they argue, led us into the lockdown so only public opinion can lead us out. The trick is to be ready to seize the moment when it comes.

Dominic Raab is in no place to settle these disputes. When he chairs meetings he stresses that, as First Secretary of State, he’s there just to facilitate discussion and carry out the boss’s instructions. When he arrives in No10, he is guided by the Prime Minister’s officials rather than his own. When asked, he says that Britain has “a Cabinet system of government” with each minister running their own department. In theory, this is true.

But in practise, the Government was designed as the Boris show. The Treasury and the Cabinet Office have been fused with No10 to create a triangle of power, under his control. Sajid Javid resigned as Chancellor in protest at all this, regarding it as a dangerous power grab. What, he said at the time, if No10 erred? The question no one really asked was what would happen if this command-and-control Napoleonic model were to suddenly lose its Napoleon.

For the moment, this might not matter: this is not the time for any big decisions. The Covid picture is still too unclear, the uncertainties too great. Other countries are still taking only small steps. Denmark is reopening primary schools and Austria small shops. Even Italy is looking at reopening its factories. Roberto Speranza, its health minister, has said this will mean “learning to coexist with the virus, because it won’t disappear”. That’s another way of bracing Italy for an increase in Covid deaths as the price of returning, slowly, towards normal life.

It’s a difficult call for anyone other than a Prime Minister to make. But with latest forecasts saying that a quarter of the British economy might have gone by the summer, it’s a decision that will be better made sooner rather than later.
User avatar
alloneword
 
Posts: 902
Joined: Mon Jan 22, 2007 9:19 am
Location: UK
Blog: View Blog (0)

Re: COVID-19 Data & Docs

Postby alloneword » Fri Apr 10, 2020 4:12 pm

More:

https://www.ft.com/content/8027d913-2e2 ... bd726105f0

The UK government is increasingly concerned about the number of avoidable deaths resulting from the coronavirus lockdown, as internal modelling suggested thousands of premature deaths resulting from the measures. ..

...one minister said that a paper produced by a cabinet subcommittee suggested that the level of avoidable deaths could “be as high as 150,000 without mitigation” and “addressing that will play a bigger role on when to end the lockdown than the economic impact.”

This figure was firmly denied by the government...
User avatar
alloneword
 
Posts: 902
Joined: Mon Jan 22, 2007 9:19 am
Location: UK
Blog: View Blog (0)

Re: COVID-19 Data & Docs

Postby JackRiddler » Fri Apr 10, 2020 5:06 pm

Work is being done to add it all up and produce a figure for “avoidable deaths” that could, in the long-term, be caused by lockdown. I’m told the early attempts have produced a figure of 150,000, far greater than those expected to die of Covid.

This is, of course, a model – just like the model for Covid deaths produced by Imperial College. But estimates of lockdown victims are being shared among those in government who worry about the social damage now underway: the domestic violence, the depression, even suicides accompanying the mass bankruptcies. But these are deaths that may, or may not, show up in national figures in a year’s time. It’s hard to weigh them up against a virus whose victims are being counted every day.


How are they going to arrive at this figure? In what time period will these excess deaths supposedly happen? Capital has motives in play too.

.
We meet at the borders of our being, we dream something of each others reality. - Harvey of R.I.

To Justice my maker from on high did incline:
I am by virtue of its might divine,
The highest Wisdom and the first Love.

TopSecret WallSt. Iraq & more
User avatar
JackRiddler
 
Posts: 15988
Joined: Wed Jan 02, 2008 2:59 pm
Location: New York City
Blog: View Blog (0)

Re: COVID-19 Data & Docs

Postby alloneword » Sat Apr 11, 2020 5:01 am

If it's "just like the model for Covid deaths produced by Imperial College", I guess we'll never know.

~

ICNARC report on COVID-19 in critical care (UK) - 04 April 2020: https://t.co/mdq8GhRQEV?amp=1 (pdf)

~

https://www.reuters.com/article/us-heal ... SKBN21L2V7

..The farmers cannot get their produce to consumers because of lockdowns that aim to stop the spread of coronavirus. In India, as in many parts of the world, restrictions on population movement are wreaking havoc on farming and food supply chains and raising concern of more widespread shortages and price spikes to come.

Across the globe, millions of laborers cannot get to the fields for harvesting and planting. There are too few truckers to keep goods moving. Air freight capacity for fresh produce has plummeted as planes are grounded. And there is a shortage of food containers for shipping because of a drop in voyages from China.

In Florida, a lack of Mexican migrant laborers means watermelon and blueberry growers face the prospect of rotting crops. Similar shortages of workers in Europe mean vegetable farms are missing the window to plant.

Such sprawling food production and distribution shocks illustrate the pandemic’s seemingly boundless capacity to suffocate economies worldwide and upend even the most essential business and consumer markets. There has been limited disruption so far to supplies of staple grains such as rice and wheat, although problems with planting and logistics are mounting...
User avatar
alloneword
 
Posts: 902
Joined: Mon Jan 22, 2007 9:19 am
Location: UK
Blog: View Blog (0)

Re: COVID-19 Data & Docs

Postby alloneword » Sat Apr 11, 2020 8:51 am

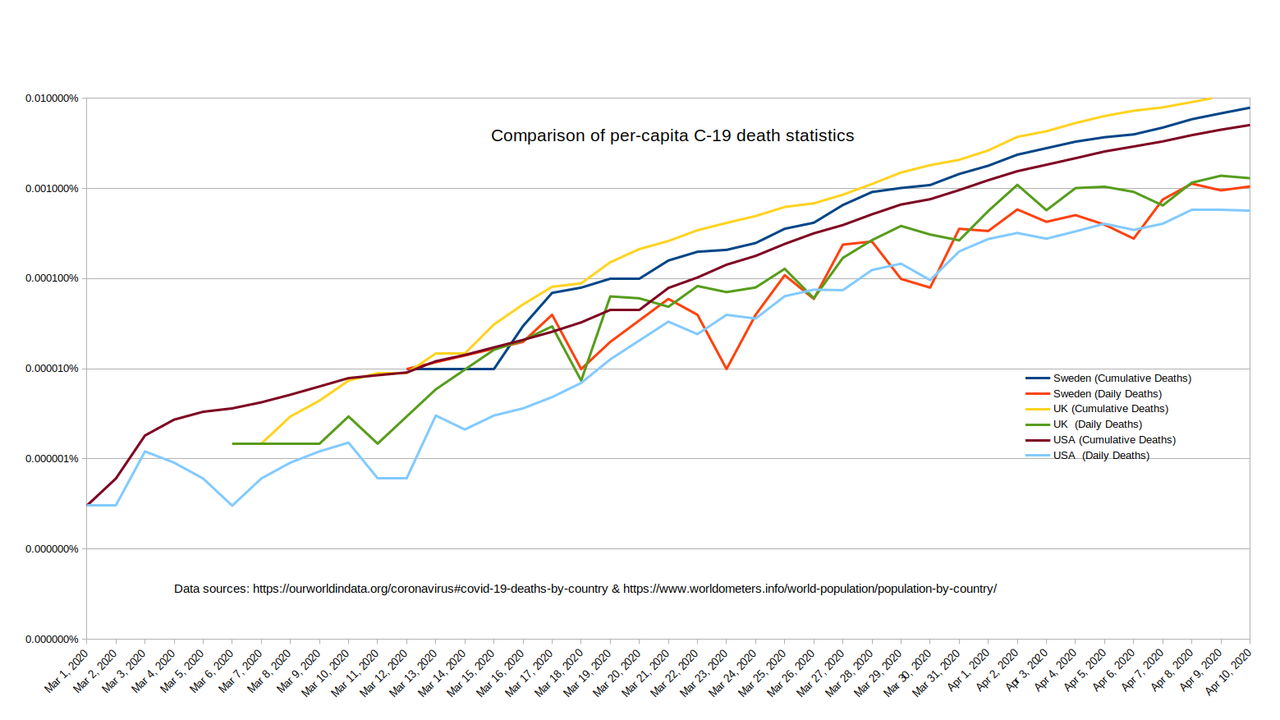
I was wondering whether the differing approaches regarding 'lockdown' were showing up in the stats, so I got the crayons out again:

Image
User avatar
alloneword
 
Posts: 902
Joined: Mon Jan 22, 2007 9:19 am
Location: UK
Blog: View Blog (0)

Re: COVID-19 Data & Docs

Postby alloneword » Sat Apr 11, 2020 11:23 am

Home>Statistics>Statistical work areas>Critical Care Bed Capacity and Urgent Operations Cancelled

Critical Care Bed Capacity and Urgent Operations Cancelled

Due to the coronavirus illness (COVID-19) and the need to release capacity across the NHS to support the response, we are pausing the collection and publication of these and some of our official statistics. This will apply to the releases listed here


https://www.england.nhs.uk/statistics/s ... -capacity/

(The link for the list of stats that have been 'paused' appears dead).
User avatar
alloneword
 
Posts: 902
Joined: Mon Jan 22, 2007 9:19 am
Location: UK
Blog: View Blog (0)

Re: COVID-19 Data & Docs

Postby alloneword » Sat Apr 11, 2020 12:24 pm

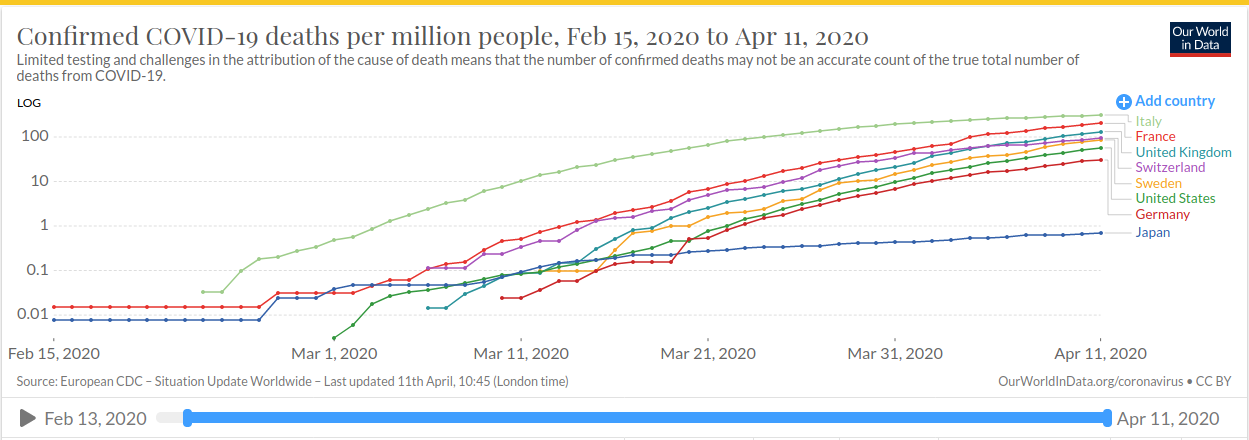
Here's another version of the graph above, but with 8 countries and measured in 'deaths per million of population'.

Image

https://ourworldindata.org/grapher/tota ... HE+DEU+ITA

Still unsure as to why Japan is such an outlier.
User avatar
alloneword
 
Posts: 902
Joined: Mon Jan 22, 2007 9:19 am
Location: UK
Blog: View Blog (0)

Re: COVID-19 Data & Docs

Postby JackRiddler » Sat Apr 11, 2020 1:07 pm

Re: Japan, no idea here either. With them it's so easy to imagine either extreme, that they're better at this than everyone else, or that they're better liars than everyone else.

Here's an attempt to get a hold of the numbers in New York. (Yeah yeah, I can see the masthead too.)

Deaths in New York City Are More Than Double the Usual Total
By Josh Katz and Margot Sanger-Katz
April 10, 2020

https://www.nytimes.com/interactive/202 ... -city.html

New York City has displayed an average death rate in of 159 a day in recent years and a typical range between 4,000 and 5,000 a month over the last 20 years. There has been a very regular cycle in which the annual peak always comes in the late winter flu season and never gets more than a small margin above 5,000, at least since the winter of 2000 when it exceeded 6K in the peak month. (The only exception in this pattern was in September 2001, which we can exclude for obvious reasons.)

The city (five boroughs) was site to at least 9,780 deaths in the month ending April 4, or 5,330 more than expected based on this month's numbers ranging back over the 20 years. The number so far accounted as C19 deaths is only 3,350, which suggests a major undercount. (Assuming it's not also the other flu.)

Note that this was as of April 4 and does not include the six days of April 5-10, which have been the peak days with deaths at 600-800 daily in New York State (and more than half of these daily in the five boroughs), and this still with possible undercounts due to deaths at home.

All this being said, and given IANAE or anything other than a rank amateur, I think the leveling of the "case" numbers over recent days indicates this is going to be the peak level, though the plateau may go on for some days yet.

Analysis of the following (and the source bases linked) invited!

NYT wrote:The measurements in our chart rely on a New York Times analysis of provisional data from the National Center for Health Statistics, along with historical data from the C.D.C. and the city’s Department of Health. They capture the number of people who died within the city limits in each month since January 2000. The historical numbers include some small adjustments because of differences in how the two public health organizations measure deaths in the city.

The recent numbers are most likely an undercount. Even in normal times, death certificates take time to be processed and collected, and complete death tallies can take weeks to become final. This is especially true for cases involving coronavirus. “Covid deaths all have to be manually coded,” said Bob Anderson, chief of the mortality statistics branch at the C.D.C.’s National Center for Health Statistics, adding that death counts from New York City typically lag actual deaths by 10 or 11 days.

But even if the current count is perfect, roughly 9,780 people have died of all causes over the past month in New York City, about 5,000 more than is typical.

The numbers for the last two weeks of the period are even more stark: nearly 7,000 dead, more than three times as many deaths as would normally be expected this time of year.

As our charts show, deaths are strongly seasonal: On average, more people die in winter and fewer in summer. These fluctuations aren’t just related to the flu. In a typical year, the vast majority of the variation in mortality is driven by seasonal variation in the number of heart disease deaths.

But the deaths over the last month dwarf what would be expected from seasonal variations, and look more like a mass casualty event. The city’s medical examiner’s office is holding bodies in refrigerated trailers outside of hospitals. City emergency medical technicians are declaring deaths in homes and on the streets instead of bringing people to hospitals.

Robert A. Jensen, the chairman of Kenyon International, a firm that helps communities respond to major disasters and attacks, said the scale of the event would leave a lasting mark on the city.

“The reminders will be cemeteries,” he said, describing European burial areas devoted to victims of the 1918 Spanish flu epidemic. “There will be whole sections that have March, April and May 2020.”

Methodology

Our calculations rely on four slightly different measurements of deaths in New York City over the past two decades.

Two C.D.C. data sets measure deaths in close to real time. One is the FluView system, which provides weekly all-cause mortality figures to help local officials evaluate flu seasons. The second is a new coronavirus dashboard of provisional death counts, which provides partly counted totals for all deaths that happened from Jan. 26 through the most recent Saturday. Both of these data sets measure all deaths that occur in the city.

The city’s health department also measures deaths that occur in the city, and provided monthly data for 2010 through 2017. We supplemented these numbers with data from the C.D.C., which keeps statistics on deaths among all people whose homes are in the city, regardless of where the deaths occur. The resident and nonresident numbers differ by small but consistent ways over time, so we adjusted the C.D.C. figures to approximate the city health data.

The exception was September 2001, when many more nonresidents died in New York City than in a typical September. To adjust for this, we added all nonresident World Trade Center deaths to the total from the C.D.C data.

In general, provisional data on deaths understates the final totals because it takes time for local authorities to count and report all deaths to the C.D.C. This means that our recent total, as high as it is, is probably smaller than the real number.

To partly account for this lag, we added the 1,396 coronavirus deaths that occurred through April 4 that have been reported by the city, but that have not yet been added to the C.D.C. data, to the total deaths counted figure.


Also:

https://www.nytimes.com/2020/04/10/nyre ... pdate.html

Number of Virus Patients in I.C.U.s Starts to Fall in New York
The figure decreased for the first time since the outbreak began, providing more evidence that the curve of infection is flattening, but deaths remain high.

April 10, 2020


April 10 counts for New York State:

TOTAL CASES
170,512
DEATHS
7,844

The number of virus patients being treated in intensive care units across the state fell by 17 people from the day before, Gov. Andrew M. Cuomo said.

Seventeen may be a very small number, but its significance is great. Just a week ago, the number of intensive-care patients — a vast majority of whom are on ventilators — was growing by more than 300 a day.

The promising news was tempered by the chilling fact that another 777 people had died of the virus on Thursday. But another important indicator, the growth of the number of virus patients in hospitals, has slowed so sharply that it has taken the health authorities by surprise. [...]


It is a surprise unless they had stuck with the initial more sober projections, back when C19 was supposed to peak in NYC during the week starting April 5. But of course acquiring the maximum possible reserves in beds and equipment was wise, and they are also not the ones to blame, at least primarily, for general response measures that may or will prove to have been excessive, counterproductive, or crazy.

Usual caveats for 777 (state number, daily, who knows if it is total or diagnosed, various reasons to expect both undercount and overcount).

As we saw in the first article, excess deaths, i.e. total deaths from all causes compared against expected numbers based on the past, are surely the most reliable indicator of C19 impact whether direct or collateral.

.
We meet at the borders of our being, we dream something of each others reality. - Harvey of R.I.

To Justice my maker from on high did incline:
I am by virtue of its might divine,
The highest Wisdom and the first Love.

TopSecret WallSt. Iraq & more
User avatar
JackRiddler
 
Posts: 15988
Joined: Wed Jan 02, 2008 2:59 pm
Location: New York City
Blog: View Blog (0)

PreviousNext

Return to Data & Research Compilations

Who is online

Users browsing this forum: No registered users and 1 guest