My last reply (slightly redacted) carried over from the end of the prior page:
Belligerent Savant » Wed Jul 02, 2025 6:26 am wrote:.
...
...the core issue here -- once again -- isn't a challenge of climate/weather patterns changing over time, but WHY such changes occur.
The notion that human activities are the PRIMARY factors for "climate change" (and therefore govt 'interventions'/policies will be required to [ostensibly] reverse such patterns) is absurd. THIS is the key point (or at least my key current position here).
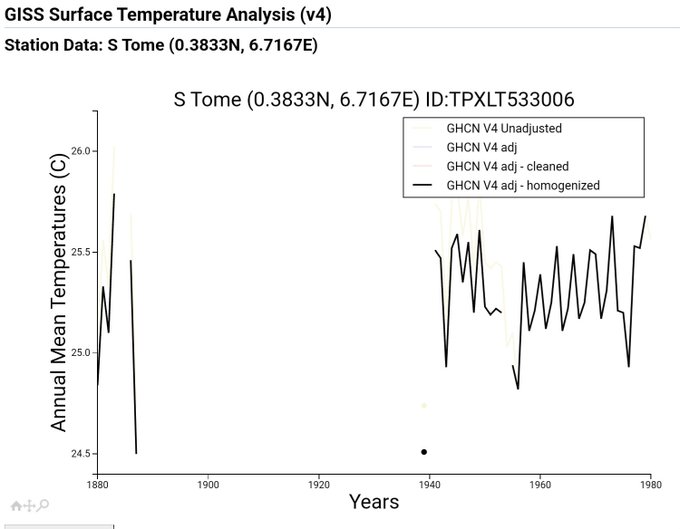
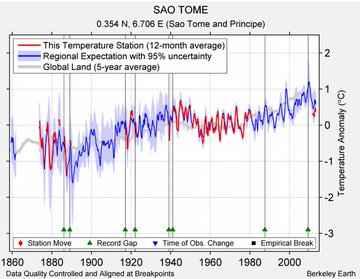
Also, Re: Berkeley Earth, a few breadcrumbs:See that little dot off the west coast of Africa? That's São Tomé and Príncipe. The GISS station data shows no trend but a huge gap in the data. Berkeley Earth fixed this by infilling the data and adding an upward trend based on their "regional expectation" (a.k.a. model).
Berkeley Earth uses "Regional Expectations" to infill and extrapolate missing data for a continent. "Regional Expectations" based on modeling. It's an industry standard so I would guess NASA does the same.
...
Berkeley Earth uses "regional expectations" (based on models) to infill, extrapolate and generally "correct" surface temp data sets. When the spin cycle is done the models match the measured temps match the models. The others are less open about it.
...
Berkeley Earth appears to create data using "Regional Expectations" based on models in areas with little or no information.
...
In July 1936 a "heat dome" of 40°C weather settled over Central North America for eleven days resulting in the deaths of over 6,000 people. There has not been a similar one since despite your assertion (Re: more recent and unprecedented heat surges).
...
Berkeley Earth adjusts and infills temperature data to match their hypothesis (regional expectation) of what they believe the temperatures should have been. They then use the adjusted/infilled to support their hypothesis. Raw GISS data is better.
...
Berkeley Earth claim they have good coverage throughout Africa in 1900.
On closer examination it appears this coverage includes a lot of infilling with presumed regional trends and wishful thinking.
Source: Select commentary by a user that goes by @JeffNor50595241, who appears to assess info by analyzing raw data instead of accepting reports that rely on models and assumptions.

A couple other data points for added consideration --
@RyanMaue
Meteorologist | Hurricane Season | Forecasts and Maps | Look Up | Meteorology
@FloridaState PhD | Michigan
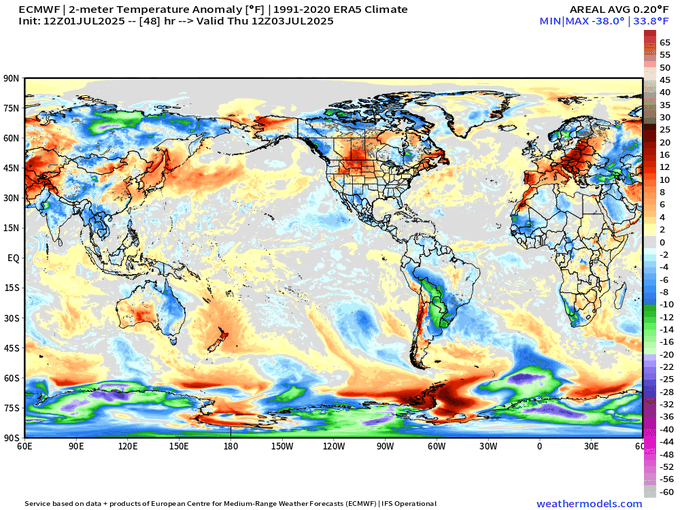
It's been a few years, but global temperatures have returned to the 30-years normal ... starting July 2025 off rather chilly.
Something weird going on with the global weather circulation ...
...
@PaulRoundy1
Professor of Atmospheric Science. I study climate variability of the tropics, and interactions between the tropics and extratropics. My tweets R my own.
The 30 years normal is the normal 15 years ago. That means we've cooled back the level of around 2010.
5:49 AM · Jul 2, 2025
·
And:
https://oz4caster.wordpress.com/cfsr/
Daily global surface temperature anomaly estimates from Climate Forecast System Reanalysis (CFSR) output based on the Global Forecast System (GFS) initialization measurements four times each day are graphed below. Daily estimates since the beginning of 2017 have been derived directly from output provided by the U.S. National Centers for Environmental Prediction (NCEP) and prior to that time were provided by the University of Maine (UM) Climate Change Institute (CCI). The graphs below should be updated on most days by 0300 UTC through the previous UTC calendar day. The first graph displays the daily CFSR estimated global surface temperature anomalies over the last 14 months along with the 365-day running average.
...
...