The scale of things

Moderators: Elvis, DrVolin, Jeff

Smallest Exoplanet Yet Discovered by ‘Listening’

Postby Allegro » Sat Feb 23, 2013 2:35 am

When I first read the quoted Dr. Kawaler, who in the article below said, “The bigger the star, the lower the frequency, or ‘pitch’ of its song,” I scratched my head. A song is composed of two or more pitches. So, I think to use the word song, one would imply plural forms as frequencies or pitches. An example of singing one or more syllables on a single pitch could be noted yet not necessarily a drone.

Granted, I’m not a scientist but a concert trained pianist in the Western classics, whose proclivity for understanding cleanly defined scientific terms used in music contexts includes understanding cleanly defined music terms used in scientific contexts, presuming, too, that distinctions can be easily defined within mutual accessions.

Nonetheless, this is a terrific article wrt the scales of things, although not mentioned, I’m guessing the scientists’ listening involves their listening to sonified data. Highlights mine; links in original.

_________________
Smallest Exoplanet Yet Discovered by ‘Listening’ to a Sun-like Star
Universe Today, Nancy Atkinson | 20FEB13

Image
^ NASA’s Kepler mission has discovered a new planetary system that is home to the smallest planet yet found around a star like our sun, approximately 210 light-years away in the constellation Lyra. Credit: NASA/Ames/JPL-Caltech

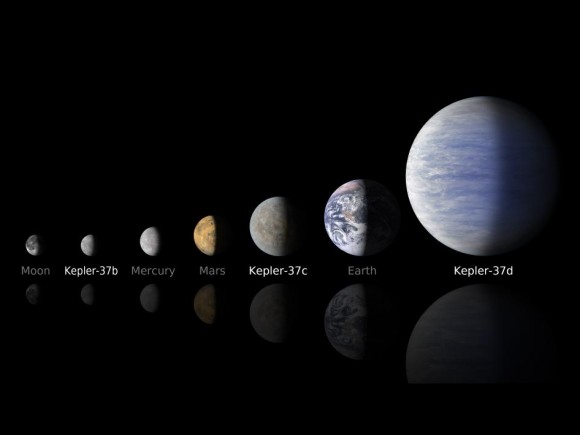
    Scientists have discovered a new planet orbiting a Sun-like star, and the exoplanet is the smallest yet found in data from the Kepler mission. The planet, Kepler-37b, is smaller than Mercury, but slightly larger than Earth’s Moon. The planet’s discovery came from a collaboration between Kepler scientists and a consortium of international researchers who employ asteroseismology — measuring oscillations in the star’s brightness caused by continuous star-quakes, and turning those tiny variations in the star’s light into sounds.

    That’s basically listening to the star by measuring sound waves,” said Steve Kawaler, from Iowa State University in the US, and a member of the research team. “The bigger the star, the lower the frequency, or ‘pitch’ of its song.”

    The measurements made by the astroseismologists allowed the Kepler research team to more accurately measure the tiny Kepler-37b, as well as revealing two other planets in the same planetary system: one slightly smaller than Earth and one twice as large.

    While Kepler 37b is likely a rocky planet, this would not be a great place for humans to live. It’s likely very hot with a smoldering surface and no atmosphere.

    “Owing to its extremely small size, similar to that of the Earth’s moon, and highly irradiated surface, Kepler-37b is very likely a rocky planet with no atmosphere or water, similar to Mercury,” the team wrote in their paper, which was published this week in Nature. “The detection of such a small planet shows for the first time that stellar systems host planets much smaller as well as much larger than anything we see in our own Solar System.”

    The host star, Kepler-37, is about 210 light-years from Earth in the constellation Lyra. All three planets orbit the star at less than the distance Mercury is to the Sun, suggesting they are very hot, inhospitable worlds. Kepler-37b orbits every 13 days at less than one-third Mercury’s distance from the Sun. The estimated surface temperature of this smoldering planet, at more than 800 degrees Fahrenheit (700 degrees Kelvin), would be hot enough to melt the zinc in a penny. Kepler-37c and Kepler-37d, orbit every 21 days and 40 days, respectively.

    Image
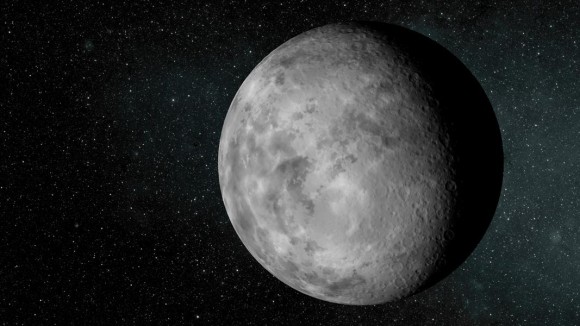
    ^ Artist’s concept of Kepler-37b. The planet is slightly larger than our moon, measuring about one-third the size of Earth. Credit: NASA/Ames/JPL-Caltech

    The size of the star must be known in order to measure the planet’s size accurately. To learn more about the properties of the star Kepler-37, scientists examined sound waves generated by the boiling motion beneath the surface of the star.

    “The technique for stellar seismology is analogous to how geologists use seismic waves generated by earthquakes to probe the interior structure of Earth,” said Travis Metcalfe, who is part of the Kepler Asteroseismic Science Consortium.

    The sound waves travel into the star and bring information back up to the surface. The waves cause oscillations that Kepler observes as a rapid flickering of the star’s brightness. The barely discernible, high-frequency oscillations in the brightness of small stars are the most difficult to measure. This is why most objects previously subjected to asteroseismic analysis are larger than the Sun.

    “Studying these oscillations [has] been done for a long time with our own Sun,” Metcalfe told Universe Today, “but the Kepler mission expanded that to thousands of Sun-like stars. Kepler-37 is the coolest star, as well as the smallest star that has been measured with asterosiesmology.”

    Kepler-37 has a radius just three-quarters of the Sun. Metcalfe said the radius of the star is known to 3 percent accuracy, which translates to exceptional accuracy in the planet’s size.

    Metcalfe launched a non-profit organization to help raise research funds for the Kepler Asteroseismic Science Consortium. The Pale Blue Dot Project allows people to adopt a star to support asteroseismology, since there is no NASA funding for asteroseismology.

    Much of the expertise for this exists in Europe and not in the US, so as a cost saving measure NASA outsourced this particular research for the Kepler mission,” Metcalfe “and NASA can’t fund researchers in other countries.”

    Find out how you can help this research by adopting one of the Kepler stars at the Pale Blue Dot Project website.

    The Kepler spacecraft carries a photometer, or light meter, to measure changes in the brightness of the stars it is focusing on in the Cygnus region in the sky.

    Image
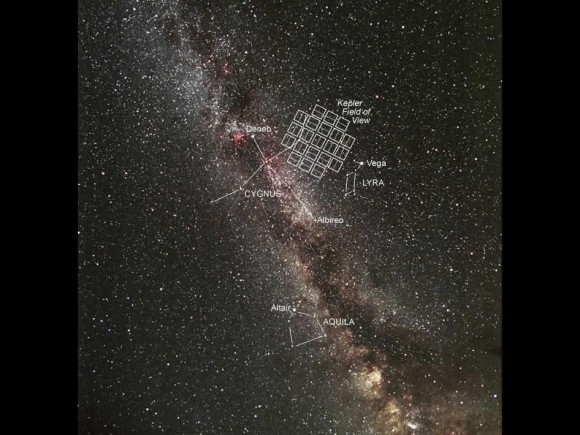
    ^ Kepler Mission Star Field. An image by Carter Roberts of the Eastbay Astronomical Society in Oakland, CA, showing the Milky Way region of the sky where the Kepler spacecraft/photometer is pointing. Each rectangle indicates the specific region of the sky covered by each CCD element of the Kepler photometer. There are a total of 42 CCD elements in pairs, each pair comprising a square. Credit: Carter Roberts / Eastbay Astronomical Society.

    Metcalfe said this discovery took a long time to verify, as the signature of this very small exoplanet was hard to confirm, to make sure the signature wasn’t coming from other sources such as an eclipsing binary star.

    Kawaler said Kepler is sending astronomers photometry data that’s “probably the best we’ll see in our lifetimes,” he said, adding that this latest discovery shows “we have a proven technology for finding small planets around other stars.”

    “We uncovered a planet smaller than any in our solar system orbiting one of the few stars that is both bright and quiet, where signal detection was possible,” said Thomas Barclay, lead author of Nature paper. “This discovery shows close-in planets can be smaller, as well as much larger, than planets orbiting our sun.”

    And are there more small planets like this out there, just waiting to be found?

    As the team wrote in their paper, “While a sample of only one planet is too small to use for determination of occurrence rates it does lend weight to the belief that planet occurrence increases exponentially with decreasing planet size.”

    Sources: phone interview with Travis Metcalfe, Iowa State University, NASA/JPL
Last edited by Allegro on Sat Feb 23, 2013 1:57 pm, edited 1 time in total.
Art will be the last bastion when all else fades away.
~ Timothy White (b 1952), American rock music journalist
_________________
User avatar
Allegro
 
Posts: 4456
Joined: Fri Jan 01, 2010 1:44 pm
Location: just right of Orion
Blog: View Blog (144)

All That Plasma Will Be Lost in Time

Postby Allegro » Sat Feb 23, 2013 4:51 am

The video below is an excellent example of when to use looped music: After seven measures of introduction in quadruple meter, you’ll hear the first chord played four times in two measures followed by a second chord, that descends the first, played four times for two more measures giving the effect of falling rain. All of two chords and four measures looped, accompanied with thunderous cracklings, the slightest rhythmic tinkling sounds, and pleasantly underplayed percussions throughout. I think the video maker knew that subtle accomplishment. The first I watched and listened, I was mesmerized, spellbound, yes, fascinated without the brain going loopey :lol:. It’s a beautiful piece! If you wouldn’t mind me saying.

Highlights mine.
_________________
All That Plasma Will Be Lost in Time, Like Tears in Rain | Phil Plait
Bad Astronomy | 21FEB13

Image
^ Towering loops of plasma raining down on the Sun, with the Earth thrown in for comparison. Click to embiggen. Image credit: NASA's Goddard Space Flight Center/SDO

    If you look at our Sun the right way, it is magnificent. For proof, I offer this stunningly beautiful video of the nearest star taken on July 19, 2012 by NASA’s Solar Dynamics Observatory. If you can watch this without your jaw hanging open and your mind aflame with wonder, then I cannot help you.


    ^ NASA, Fiery Looping Rain | Lars Leonhard, Music Thunderbolt

    What you’re seeing is the profound impact of magnetism on the material in the Sun. I’ve described this effect before (with lots of juicy details here), but in a nutshell: The gas inside the Sun is so hot it’s ionized, stripped of electrons. When that happens it’s more beholden to magnetism than gravity, and when the magnetic field lines pierce the Sun’s surface they form loops along which the ionized gas (called plasma) flows along them.

    The bright flare happens when the stored magnetic energy erupts outward, usually due to what is essentially a short-circuit in the field. That happens near the beginning of the video, and is so bright it saturates SDO’s detectors (and you can see repeated ghost images to the upper left and right of the flare as the light reflects inside SDO’s optics). Then things settle down, and that’s when the beauty really begins: The plasma flows down the loops, raining down onto the Sun’s surface.

    And it goes on and on. This video represents a total elapsed time of over 21 hours.* The energy flowing along those magnetic loops is immense, enough to power our entire planet for many millennia. Note the part about a minute in when the size of the Earth is shown for comparison. Incredible.

    Although this looks like fire, it’s not. The images used to make this video are in the far ultraviolet, showing gas at a temperature of nearly 100,000° Celsius (180,000° F). The color is added after the fact to make details easier to see—but those fiery red, yellows, and oranges do tickle the imagination, don’t they? The color adds to the impression of dancing energy and heat.

    That barely constrained violence can be difficult to square with the grace and elegance of the motion. The Sun can damage our civilization, yet we also depend on it for our existence. But there you go: The Universe is full of such dichotomies.

    It is harsh, inhospitable, destructive, and capable of crushing indifference.

    It is pleasing, habitable, serene, and capable of life-altering beauty.

    I wouldn’t have it any other way.


    * [Correction: I had originally said this eruption lasted over nine hours. While technically correct, it actually went on for over 21 hours.]
Art will be the last bastion when all else fades away.
~ Timothy White (b 1952), American rock music journalist
_________________
User avatar
Allegro
 
Posts: 4456
Joined: Fri Jan 01, 2010 1:44 pm
Location: just right of Orion
Blog: View Blog (144)

Re: All That Plasma Will Be Lost in Time

Postby Jerky » Sat Feb 23, 2013 5:26 am

Allegro wrote:If you look at our Sun the right way, it is magnificent.


That's kind of a funny statement when you consider how many foundational culture myths, how much religious fervor, and how much general wide-eyed, gape-mouthed AWE has been generated over the years, since we first came down from the trees and probably prior to that, by the Sun. It never occurred to me that there might be a way to look at the Sun in which it is NOT "magnificent". It's the very definition, the personification of magnificence.

Jerky
Last edited by Jerky on Sat Feb 23, 2013 5:28 am, edited 1 time in total.
User avatar
Jerky
 
Posts: 2240
Joined: Fri Apr 22, 2005 6:28 pm
Location: Toronto, ON
Blog: View Blog (0)

Re: The scale of things

Postby Jerky » Sat Feb 23, 2013 5:27 am

Perhaps "spectacular" would be more what you mean?

Jerky
User avatar
Jerky
 
Posts: 2240
Joined: Fri Apr 22, 2005 6:28 pm
Location: Toronto, ON
Blog: View Blog (0)

magnificent, spectacular | The scale of things

Postby Allegro » Sun Feb 24, 2013 1:18 pm

Jerky wrote:
Allegro wrote:If you look at our Sun the right way, it is magnificent.
That's kind of a funny statement when you consider how many foundational culture myths, how much religious fervor, and how much general wide-eyed, gape-mouthed AWE has been generated over the years, since we first came down from the trees and probably prior to that, by the Sun. It never occurred to me that there might be a way to look at the Sun in which it is NOT "magnificent". It's the very definition, the personification of magnificence.

Jerky
Jerky wrote:Perhaps "spectacular" would be more what you mean?

Jerky
You erred by leaving my username in the quote box. Apparently, you didn’t notice you’ve quoted the author of the piece I copied into RI. Moreover, I could tend to agree with what one might choose to think is magnificent or spectacular, but I do not suggest that I would assume a presumptuous role for speaking on an author’s behalf.

Staying with the idea of the scale of things, therefore, I’d say spectacular would describe, as examples, a spacecraft, or the opera Aïda, or a spacious and elaborately designed cathedral, mosque, or theater.

Personally, I’d keep the word magnificent when describing the Sun, or Earth upon which I move. Whatever I might claim as magnificent elements seen or yet unseen in nature produce a moment in which euphoric feelings are expressed for elements which, from their beginnings, I could not have influenced their evolution. There is a possibility those words aren’t rightly put, but will do.
Last edited by Allegro on Sun Feb 24, 2013 6:30 pm, edited 1 time in total.
Art will be the last bastion when all else fades away.
~ Timothy White (b 1952), American rock music journalist
_________________
User avatar
Allegro
 
Posts: 4456
Joined: Fri Jan 01, 2010 1:44 pm
Location: just right of Orion
Blog: View Blog (144)

Movements in (Infra)Red | The scale of things

Postby Allegro » Sun Feb 24, 2013 1:46 pm

Highlights mine.

_________________
Movements in (Infra)Red | Phil Plait
Bad Astronomy | Friday, 22FEB13

Image
^ In the infrared, corn looks a little different. Image credit: Andrew Hurtleff (frame from the video)

    Look around you. What do you see?

    You may have an amazing array of objects around you that you can see in fine detail, their colors vivid and bright, what seems like an amazing variety of hues.

    But think on this: What you’re seeing is just an incredibly small slice of what’s actually there. Our eyes are sensitive to only a relatively few colors available in the electromagnetic spectrum—the scientific term for “light”. The bluest color we can see has a wavelength of about 400 nanometers (a nanometer is a billionth of a meter; for comparison, a human hair is 100,000 nm wide), and the reddest about 700—not even a factor of two in range! But light can have wavelengths far smaller than a nanometer at one end of the spectrum, and kilometers long at the other (theoretically, there is no limit to how long a wavelength can be).

    Near-infrared (NIR) light has a wavelength just outside what we can see on the red end, with wavelengths from 800 to roughly 2000 nm (NIR is more of a generic term than a specific color range). While our eyes can’t detect it, the light-sensitive chips in cameras usually can. And when you use a filter that blocks visible light but lets through the NIR, the world looks different. Mostly the same, but with an odd twist, a skewed balance of brightness that makes it seem unearthly, delicate, and beautiful.

    Photographer Andrew Hurtleff took advantage of this to create an astonishing time-lapse video using infrared images, which he calls Movements in Red:


    The shots making up the video are familiar scenes, but the lighting is just peculiar. The most obvious change is that leaves appear bright white, almost glowing. Leaves absorb almost all wavelengths of visible light except for green, which they reflect. When that light hits our eyes, we see the leaves as being green (ironically, we say the leaves are green, when in fact that’s the color of light they reject).

    But in the infrared things are different. Here is a graph showing the color of the light reflected by leaves (specifically Chionophila jamesii, commonly called Snowlover):

    Image
    ^ The amount of infrared light reflected by a leaf. In visible light, leaves are dark (reflecting only a bit of green). In the IR, though, they’re very reflective. Image credit: Adapted from a graph by Slaton et al., American Journal of Botany.

    The colors go along the horizontal axis, and the percentage of light reflected along the vertical (100% would be total reflection and 0% total absorption). You can see a small bump around 550 nm, which is green light. But then look to the infrared: Starting around 700 nm, just outside our vision, the reflectance rockets up. So while leaves to our eyes appear bright in the green, to something with infrared eyes—like Hurtleff’s camera—leaves are far brighter.

    I’ll note that using an IR filter means very little visible light gets into the camera at best, so any sense of actual color you see in the video is probably added afterward for artistry; Hurtleff has several fine art infrared prints on his site, and in some the sky is blue. Scientifically that’s a bit of a stretch, but artistically the effect can’t be denied. It’s eerily beautiful.

    By the way, you can see all this for yourself. If you have any sort of electronic camera (in your phone, say), point a remote control at it and hit a button on the remote. Your eye will see nothing, but through the camera you’ll see the diode at the remote’s tip glowing or flickering. Most remotes use encoded near-infrared pulses to control your electronics, invisible to the eye but quite bright to your camera (and, of course, to the infrared sensors on your electronics designed to receive the signals).

    It’s a reminder that everyday, all the time, you are surrounded by invisible information. We are all blind to it…unless, of course, we have science. With that, we can literally see better the true nature of the world around us…and we can find there is more beauty there than normally meets the eye.
Art will be the last bastion when all else fades away.
~ Timothy White (b 1952), American rock music journalist
_________________
User avatar
Allegro
 
Posts: 4456
Joined: Fri Jan 01, 2010 1:44 pm
Location: just right of Orion
Blog: View Blog (144)

Re: The scale of things

Postby DrEvil » Sun Feb 24, 2013 7:26 pm

Any thoughts on this anyone?

Hint of 150 MHz radio emission from the Neptune-mass extrasolar transiting planet HAT-P-11b

http://nextbigfuture.com/2013/02/hint-o ... -from.html

the Arxiv paper (PDF):
http://arxiv.org/pdf/1302.4612v1.pdf
"I only read American. I want my fantasy pure." - Dave
User avatar
DrEvil
 
Posts: 4142
Joined: Mon Mar 22, 2010 1:37 pm
Blog: View Blog (0)

Re: The scale of things

Postby Allegro » Tue Feb 26, 2013 1:24 am

^^^ Something might be coming up for that one, DrEvil. On the page you linked, I read the abstract, and its flight over my head was an easy one :). Some of the ideas though reminded me of a stack of research on sonification I’ve not posted even though several RI posts during the last several weeks have tempted me. So, I’ll post one or two, shortly.

Thanks, again!
DrEvil wrote:Any thoughts on this anyone?

Hint of 150 MHz radio emission from the Neptune-mass extrasolar transiting planet HAT-P-11b

http://nextbigfuture.com/2013/02/hint-o ... -from.html

the Arxiv paper (PDF):
http://arxiv.org/pdf/1302.4612v1.pdf
By the way, the pdf opened, but all of the text was missing on each of three attempts. Three or four pdf’s stored on my computer opened fine.
Art will be the last bastion when all else fades away.
~ Timothy White (b 1952), American rock music journalist
_________________
User avatar
Allegro
 
Posts: 4456
Joined: Fri Jan 01, 2010 1:44 pm
Location: just right of Orion
Blog: View Blog (144)

Moon Rise over an Arsenic Lake | The scale of things

Postby Allegro » Tue Feb 26, 2013 1:39 am

Highlights mine.

_________________
Moon Rise over an Arsenic Lake | Phil Plait
Bad Astronomy | Monday, 25FEB13

    I sometimes wonder if aliens will have clocks.

    It seems inevitable, especially if they live on a spinning planet that orbits a star. The motions of the stars as the planet spins, the daily rising and setting of the Sun, the phases of the moon if the planet has one—all these movements fit together like the gears of a clock, ticking away in patterns that seem obvious once you notice them.

    They happen here on Earth, and if you keep your eyes open—and skyward—you can’t help but see them. And sometimes the hands of that celestial clock align, producing wonderful things. Photographer Jeff Sullivan was able to snap a picture of just such a wonderful thing:

    Image
    ^ The full Moon rising over Mono Lake, California. Image credit: Jeff Sullivan, used by permission.

    I love this shot. It’s got so much going on! Sullivan took it on Jan. 26, 2013 just after sunset. The full Moon was rising, as it must just after sunset: For the Moon to be full, it has to be opposite the Sun in the sky, so we see the fully lit face of our satellite. If it’s opposite the Sun, then it rises at sunset and sets at sunrise. He even made a very cool time lapse video of it (the shaking is due to the wind):


    That’s wild. But there’s more. The pink band across the top of the photo is called the Belt of Venus, and we’ll get to that in just a moment. But perhaps more interesting is the dark horizontal band just above the horizon in the photo and in the video. Some people see it and think it’s just the sky getting darker as the Sun sets. That’s kinda sorta true, but it’s more than that. It’s actually the shadow of the edge of the Earth on the sky!

    On a hazy day, have you ever seen the shadow of a cloud or mountain stretch across the sky? Particles in the air are lit by the setting Sun, but if the cloud or mountain blocks the Sun, some particles are shadowed, and appear darker. If conditions are right, this happens on a much grander scale, with the horizon of the Earth itself blocking the Sun.

    This drawing I made might help:

    Image
    ^ A brilliantly-drawn diagram showing the setting Sun and the shadow of the Earth projected on the sky. Image credit: Phil Plait

    When the Sun is just below the horizon (on the left, west), air above your head is still lit up. But air far enough to the east (to the right) sees the Sun below the horizon, blocked by the Earth. That air is dark, so when you look to the horizon opposite the Sun you see a broad band of dark sky. As the Sun sets further, the top of the band creeps upward. Eventually the sky darkens completely once the Sun is far enough below the horizon. This is the same reason we have twilight, by the way. Without an atmosphere, the sky would darken the instant the Sun dips below the western horizon.

    Since this dark band is to the east, and the Moon was full and rising in the east as well, it appears to be inside the dark zone. Pretty!

    There’s an irony here, too. Technically, the Belt of Venus is the pinkish band just above the top of the Earth's shadow line, and not the dark band itself. It’s name may come from that glow, referring to the girdle worn by the goddess Venus—I’ve seen that etymology bandied about, but I’m not sure it’s true. Anyway, the irony is that the planet Venus can never be in that part of the sky. Venus orbits the Sun closer than the Earth, so, due to geometry, can never appear more than about 45° away from the Sun. Since the Belt is opposite the Sun, 180° away, Venus can never be in it.

    And one more thing, since I can’t resist. Sullivan took this shot at Mono Lake, California. If that sounds familiar, that may be because it was the epicenter of the “arsenic life” brouhaha in 2012, when scientists claimed they had found bacteria that could metabolize arsenic; a claim that was later shown to almost certainly be wrong. It was fun for a while though.

    Sullivan took lots of pictures when he was at Mono Lake, and they’re all quite lovely. Go take a look. And of course the Belt of Venus itself is a fascinating thing to see in person, especially if you watch it over a few minutes and see it slowly move upwards. All you need is a good sunset and a clear view to the east. Give it a try! There’s a lot going on in the sky all the time, if you just go out and look up.
Art will be the last bastion when all else fades away.
~ Timothy White (b 1952), American rock music journalist
_________________
User avatar
Allegro
 
Posts: 4456
Joined: Fri Jan 01, 2010 1:44 pm
Location: just right of Orion
Blog: View Blog (144)

Re: The scale of things

Postby DrEvil » Tue Feb 26, 2013 1:40 am

Allegro wrote:By the way, the pdf opened, but all of the text was missing on each of three attempts. Three or four pdf’s stored on my computer opened fine.


They're using some kind of wrapper to make their own custom interface, so there's probably java or something involved. You can download the pdf directly from here:
http://arxiv.org/abs/1302.4612

And no, I don't really understand much of it either :D
Probably a perfectly natural explanation, but you never know..

Edit: Here's a decent reddit (Is it "a reddit", or "a reddit thread"? Never could figure that out :? ):
http://en.reddit.com/r/science/comments ... _from_the/

Most likely natural from what I can decipher, but nothing definite yet.
"I only read American. I want my fantasy pure." - Dave
User avatar
DrEvil
 
Posts: 4142
Joined: Mon Mar 22, 2010 1:37 pm
Blog: View Blog (0)

Jupiter, sonification | The scale of things

Postby Allegro » Tue Feb 26, 2013 4:22 am

The confidence factor that’s being developed after listening to and mentally critiquing many sonifications, narratives and reports online has finally proved useful, I think. I say, ‘I think!’ We shall see how usefully worded I can write some explanations later on :).

I relaxed after reading the following NASA essay that favors answers to only a few of the several curiosities wrt data visualizations and aural sonifications. One curiosity has been whether dark matter produces a signal that can be sonified, and I found this Nature article, which describes to what extent Nobel prize winner Samuel Ting might be on to something.

My primary curiosity in question form has been, ‘Where in the Universe is music not?’ Or, perhaps a better inquiry would be, ‘Where in the Universe isn’t (any type of) a signal apparent?’ Meaning, I’m just too curious, too curious since the Higgs Boson-like particle was sonified. That’s all :).

Included in the essay below was an image that has been replaced by me with the video that presents the same data, visual and aural; the original page holds only the audio.

Three mp3 sound files with their respective narratives about Jupiter are on the page of origin.

_________________
NASA | Solar System Exploration
Sounds of Jupiter

    One approach scientists use to make sense of the data from instruments is to make pictures and graphs to represent the data. This is called “data visualization”. Some types of data, especially radio signals, are very similar in many ways to sound. The power of a radio signal is analogous to the volume of a sound. The radio signal also varies in terms of the frequency and wavelength of the radio waves, which is like the variation in pitch of sound waves. So scientists sometimes translate radio signals into sound to better understand the signals. This approach is called “data sonification”. Click the [video] image on your left to hear the sound that corresponds to this graph.

    On June 27, 1996, the Galileo spacecraft made the first flyby of Jupiter’s largest moon, Ganymede. The Plasma Wave Experiment (PWS), using an electric dipole antenna, recorded the signature of a magnetosphere at Ganymede. This is the first example of a magnetosphere associated with a moon. The PWS data are represented here as both sounds and a rainbow-colored spectrogram. Approximately 45 minutes of PWS observations are transformed and compressed to 60 seconds. Time increases to the right and frequency (pitch) increases vertically. Color is used to indicate wave intensity, red corresponding to strong waves, blue corresponding to weak waves. The audio track represents the PWS data and is synchronized with the display of the rainbow-colored spectrogram. The pitch of the sound is reduced by a factor of 9 from the measured frequency and follows the location of the signal on the rainbow-colored spectrogram. The entrance into the Ganymede magnetosphere is marked by a strong burst of noise about 6-10 seconds into the recording. As the spacecraft approaches Ganymede, an irregular tone can be heard rising in frequency, reaching a peak and then declining. The pitch of this tone is a measure of the density of charged particles near Ganymede. Both the plasma wave and magnetometer data show that a strong magnetic field exists around Ganymede.
Art will be the last bastion when all else fades away.
~ Timothy White (b 1952), American rock music journalist
_________________
User avatar
Allegro
 
Posts: 4456
Joined: Fri Jan 01, 2010 1:44 pm
Location: just right of Orion
Blog: View Blog (144)

Re: The scale of things

Postby justdrew » Tue Feb 26, 2013 6:06 am


I've been thinking about doing a sonification of DNA sequences, or rather musification
By 1964 there were 1.5 million mobile phone users in the US
User avatar
justdrew
 
Posts: 11966
Joined: Tue May 24, 2005 7:57 pm
Location: unknown
Blog: View Blog (11)

Re: The scale of things

Postby Allegro » Wed Feb 27, 2013 11:16 pm

justdrew wrote:I've been thinking about doing a sonification of DNA sequences, or rather musification
Seriously? Does musification suggest AutoTune? You would apply AutoTune or an equivalent voicing technology to sonified DNA? Why don’t you think up a more complicated project? :lol:
Art will be the last bastion when all else fades away.
~ Timothy White (b 1952), American rock music journalist
_________________
User avatar
Allegro
 
Posts: 4456
Joined: Fri Jan 01, 2010 1:44 pm
Location: just right of Orion
Blog: View Blog (144)

Sonification, Audification | The scale of things

Postby Allegro » Thu Feb 28, 2013 12:32 am

These two descriptions were helpful in the early days of attempting an understanding of something mysterious. Not so mysterious, anymore, but complicated or time consuming for some, even with helps of algorithms, I would think.

If a producer plans a musical sonification, I understand there are softwares that automatically assign to the data the musical notes of a chosen scale, but that step is only one of many, for which time investments for tedious, multiple musical sonifications would have to be generous.

_________________
Sonification wiki

    Sonification, a form of auditory display, is the use of non-speech audio to convey information or perceptualize data. Auditory perception has high temporal and pressure resolution, which opens up possibilities for it as an alternative or complement to visualization techniques.

    For example, the Geiger counter plays a sonification to help users know how much radiation is present. The number and frequency of audio clicks are directly dependent on the radiation level in the immediate vicinity of the device.

    Though many experiments with data sonification are explored at forums such as the International Community for Auditory Display (ICAD), sonification faces many challenges to widespread use for presenting and analyzing data. It is difficult to provide adequate context for interpreting sonifications of data. Also, there is not yet a flexible tool for sonification research and actual data exploration, meaning many sonification attempts are coded from scratch.

_________________
Audification wiki

    Audification is an auditory display technique for representing a sequence of data values as sound. An audification does this by interpreting the data sequence, usually a time series, as an audio waveform: input data is mapped to sound pressure levels. Various signal processing is often used to bring out salient data features.

    Audification is particularly applicable to large datasets with periodic components. Many data values are needed to make an audification, and audification allows the listener to hear periodic components as frequencies. A 2007 study by Sandra Pauletto and Andy Hunt at the University of York suggests that users were able to detect attributes such as noise, repetitive elements, regular oscillations, discontinuities, and signal power in audification of time-series data to a degree comparable with using visual inspection of spectrograms. Applications include audification of seismic data and of human neurophysiological signals.

    Audification is a kind of sonification, a term which encompasses all techniques for representing data in non-speech audio.
Art will be the last bastion when all else fades away.
~ Timothy White (b 1952), American rock music journalist
_________________
User avatar
Allegro
 
Posts: 4456
Joined: Fri Jan 01, 2010 1:44 pm
Location: just right of Orion
Blog: View Blog (144)

The Vela Pulsar as a Spirograph

Postby Allegro » Thu Feb 28, 2013 1:12 am

Highlights mine.

_________________
The Vela Pulsar as a Spirograph
Universe Today, Nancy Atkinson | 27FEB13

Image
^ This image compresses the Vela movie sequence into a single snapshot by merging pie-slice sections from eight individual frames. Credit: NASA/DOE/Fermi LAT Collaboration

    I loved my Spirograph when I was young, and obviously Eric Charles, a physicist with the Fermi Gamma-ray Space Telescope team did too. Charles has taken data from Fermi’s Large Area Telescope and turned it into a mesmerizing movie of the Vela Pulsar. It actually is a reflection of the complex motion of the spacecraft as it stared at the pulsar.

    The video shows the intricate pattern traced by the Fermi Gamma-ray Space Telescope’s view of the Vela Pulsar over the spacecraft’s 51 months in orbit.


    Fermi orbits our planet every 95 minutes, building up increasingly deeper views of the universe with every circuit. Its wide-eyed Large Area Telescope (LAT) sweeps across the entire sky every three hours, capturing the highest-energy form of lightgamma raysfrom sources across the universe. The Fermi telescope has given us our best view yet of the bizarre world of the high energy Universe, which include supermassive black holes billions of light-years away to intriguing objects in our own galaxy, such as X-ray binaries, supernova remnants and pulsars.

    Francis Reddy from the Goddard Spaceflight Center describes the movie:

      The Vela pulsar outlines a fascinating pattern in this movie showing 51 months of position and exposure data from Fermi’s Large Area Telescope (LAT). The pattern reflects numerous motions of the spacecraft, including its orbit around Earth, the precession of its orbital plane, the manner in which the LAT nods north and south on alternate orbits, and more. The movie renders Vela’s position in a fisheye perspective, where the middle of the pattern corresponds to the central and most sensitive portion of the LAT’s field of view. The edge of the pattern is 90 degrees away from the center and well beyond what scientists regard as the effective limit of the LAT’s vision. Better knowledge of how the LAT’s sensitivity changes across its field of view helps Fermi scientists better understand both the instrument and the data it returns. The pulsar traces out a loopy, hypnotic pattern reminiscent of art produced by the colored pens and spinning gears of a Spirograph, a children’s toy that produces geometric patterns.

    The Vela pulsar spins 11 times a second and is the brightest persistent source of gamma rays the LAT sees. While gamma-ray bursts and flares from distant black holes occasionally outshine the pulsar, the Vela pulsar is like a persistant beacon, much like the light from a lighthouse.

    Find out more about this movie and the Fermi Telescope here.
Art will be the last bastion when all else fades away.
~ Timothy White (b 1952), American rock music journalist
_________________
User avatar
Allegro
 
Posts: 4456
Joined: Fri Jan 01, 2010 1:44 pm
Location: just right of Orion
Blog: View Blog (144)

PreviousNext

Return to General Discussion

Who is online

Users browsing this forum: No registered users and 4 guests