The scale of things

Moderators: Elvis, DrVolin, Jeff

artistically creative movements | von Kármán vortices

Postby Allegro » Wed Apr 17, 2013 11:32 am

Hello, 1879! Thank you for your post, and for sending me back into the classroom :D. Thank you too for thinking of me. By the way, I’m wondering just how many scientists and science-friendlies have been and are in RI.

Now I’m curious to see a scientist’s (musical) sonification of a von Kármán vortex street. I’ll go searching.

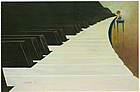
It’s invisible movements of nature—of which I’m only aware when a scientist points to them—that appear when dancers, pianists, violinists, singers, painters, drawers, sculptors, etc., move their bodies during those thousands of hours creating within their particular disciplines. Those artistically creative movements—the doing of them rather than an end-product—have captured my attention for a long time.

Oh, so many questions! Now the beauty of vibrations and rhythms of complex von Kármán vortices is added to all of it.

:hug1: Thanks to 1879,
and to numerous other :hug1: RI posters,
and to all :hug1: those lurking.

~ A.
Art will be the last bastion when all else fades away.
~ Timothy White (b 1952), American rock music journalist
_________________
User avatar
Allegro
 
Posts: 4456
Joined: Fri Jan 01, 2010 1:44 pm
Location: just right of Orion
Blog: View Blog (144)

Use of a Sonification Prototype by Astrophysicists

Postby Allegro » Sat Apr 20, 2013 3:05 am

For me, at the start of researching sonifications, the curiosity of some import was the training of astrophysicists for listening to (musical) sonifications when it’s likely (some, many, most?) scientists’ listening for distinguishing pitches might not come too easily. There are online lectures, demonstrations and experiments by non-scientists with regard to sonification, however, how were scientists to be trained? In which countries and universities were trainings developed?

The following abstract was the only one of its kind found, to date. Highlights mine.

_________________
    A Study of the Use of a Sonification Prototype by Astrophysicists
    ⋅ Submitted by Wanda Diaz
    ⋅ Affiliation | University of Glasgow
    ⋅ All authors | Wanda L. Diaz-Merced, Stephen Brewster Glasgow Interactive Systems Group School of Computing Science University of Glasgow Glasgow UK G12 8QQ wanda@dcs.gla.ac.uk stephen@dcs.gla.ac.uk Robert M. Candey NASA Goddard Space Flight Center Code 672 Greenbelt, MD USA 20771 Robert.M.Candey@nasa.gov Matthew Schneps Laboratory of Visual Learning Harvard Smithsonian Center for Astrophysics 60 Garden Street Cambridge MA 02138, USA mschneps@cfa.harvard.edu
    ⋅ Keywords | Sonification, Non-speech sound, information interfaces
    ⋅ Paper link Download
    ⋅ Submitted 2013-01-09 06:28

    Submission history
    This paper evidences astrophysicists needs to improve information interfaces and displays. It also evidences astrophysicists willingness to explore multimodal perceptualisation to explore space extended data sets where the interesting part of the data may be located away from the direction of gaze. It has not been submitted anywhere else but it lends itself for discussion on displays (unimodal and multimodal), applied to training techniques, control of attention mechanisms to improve the display perceptualisation and particular needs of target audiences at different stages of their career.

    Abstract
    This paper presents the results of a focus group and usability evaluation of a new sonification technique (visualization using sound) by end users. Of the few sonification systems for space physicists, none have been designed and tested with end-users, which results in none of them being used in practice. In order to create effective sonifications that will be usable and useful to space physicists, user studies need to be undertaken to fully understand their needs and requirements. The focus group and usability evaluation research presented here are being used in the development of the xSonify prototype (Spdf.gsfc.nasa.gov/research/ sonification/sonification_software.html).

    Baptiste Caramiaux, Goldsmiths, University of London,
    wrote on 2013-02-01 11:40
    Quality: 3 | Problem of structure
    Appropriate: 4 | alternative way of analyzing data
    Discussion potential: 2 | not controversial

    Diemo Schwarz, Ircam,
    wrote on 2013-02-05 10:05
    Quality: 3 | missing evaluation and details
    Appropriate: 2 | not very challenging nor alternative
    Discussion potential: 4 | multi-modality, user-centric design
Last edited by Allegro on Sun Apr 21, 2013 1:05 am, edited 1 time in total.
Art will be the last bastion when all else fades away.
~ Timothy White (b 1952), American rock music journalist
_________________
User avatar
Allegro
 
Posts: 4456
Joined: Fri Jan 01, 2010 1:44 pm
Location: just right of Orion
Blog: View Blog (144)

Snowcano

Postby Allegro » Sat Apr 20, 2013 5:58 pm

Highlights mine.

_________________
Snowcano | Phil Plait
Bad Astronomy | Monday, April 15, 2013, at 12:00 PM

Because pictures of volcanoes from space are never not cool, here is a shot looking straight down on Shiveluch, snowy and smoldering on Russia’s Kamchatka Peninsula:

Image
^ The Shiveluch volcano in Kamchatka, Russia, smolderingly visible from space. Click to hephaestenate. Image credit: NASA Earth Observatory/Jesse Allen/Robert Simmon, using data from the NASA/GSFC/METI/ERSDAC/JAROS, and U.S./Japan ASTER Science Team.

    You really want to click that picture to see it in its full glory. You can clearly see the gullies carved by previous eruptions, sinuously snaking their way across the landscape. This is actually one small piece of a far larger and devastatingly gorgeous 8183x16626 pixel (23 Mb!) overview of the whole area—featuring several other huge volcanoes such as Bezymianny, Tolbachik, Kizimen, and Klyuchevskaya, which are also erupting in the picture (click those to see incredible earlier space-based photos of them), as well as many smaller cones dotting the area.

    This photo was taken on April 3, 2013, by the Terra Earth-observing satellite using ASTER, the Advanced Spaceborne Thermal Emission and Reflection Radiometer. This instrument sees visible light as well as in the infrared, including thermal infrared, emitted by hot objects (like, say, lava). Terra’s mission is to observe our planet and see how the climate is changing by examining how our different environments (land, water, ice, and air) interact with each other. It monitors air pollution in the form of aerosols and carbon monoxide, as well as a host of other services. It’s a wonderful mission.

    When it took this amazing shot of Shiveluch, the wind was relatively calm, only blowing gently north. You can see the plume from Shiveluch as it reaches skyward; the white in it is from steam, the reddish-brown from volcanic gases. For scale, the image above is about 25 kilometers (15 miles) across. This region is pretty difficult for geologists and volcanologists to reach, so satellite images like this provide critical near-real-time data on activity in the area. If you love this stuff like I do, then you can also see what’s happening via the Kamchatka Volcanic Eruption Response Team site, which provides updates on eruptions and seismic activity in the area.

    And I do love this stuff. Science is cool. In this case, you could even say it rocks.
Art will be the last bastion when all else fades away.
~ Timothy White (b 1952), American rock music journalist
_________________
User avatar
Allegro
 
Posts: 4456
Joined: Fri Jan 01, 2010 1:44 pm
Location: just right of Orion
Blog: View Blog (144)

New Kind of Gamma Ray Burst is Ultra Long-Lasting

Postby Allegro » Sat Apr 20, 2013 6:20 pm

Highlights mine.

_________________
New Kind of Gamma Ray Burst is Ultra Long-Lasting
Universe Today, Nancy Atkinson | April 16, 2013

Image
^ GRB 111209A exploded on Dec. 9, 2011. The blast produced high-energy emission for an astonishing seven hours, earning a record as the longest-duration GRB ever observed. This false-color image shows the event as captured by the X-ray Telescope aboard NASA’s Swift satellite. Credit: NASA/Swift/B. Gendre (ASDC/INAF-OAR/ARTEMIS)

    According to astronomer Andrew Levan, there’s an old adage in studying gamma ray bursts: “When you’ve seen one gamma ray burst, you’ve seen … only one gamma ray burst. They aren’t all the same,” he said during a press briefing on April 16 discussing the discovery of a very different kind of GRB – a type that comes in a new long-lasting flavor.

    Three of these unusual long-lasting stellar explosions have recently been discovered using the Swift satellite and other international telescopes, and one, named GRB 111209A, is the longest GRB ever observed, with a duration of at least 25,000 seconds, or about 7 hours.

    “We have observed the longest gamma ray burst in modern history, and think this event is caused by the death of a blue supergiant,” said Bruce Gendre, a researcher now associated with the French National Center for Scientific Research who led this study while at the Italian Space Agency’s Science Data Center in Frascati, Italy. “It caused the most powerful stellar explosion in recent history, and likely since the Big Bang occurred.”

    The astronomers said these three GRBs represent a previously unrecognized class of these stellar explosions, which arise from the catastrophic deaths of supergiant stars hundreds of times larger than our Sun. GRBs are the most luminous and mysterious explosions in the Universe. The blasts emit surges of gamma rays — the most powerful form of light — as well as X-rays, and they produce afterglows that can be observed at optical and radio energies.

    Swift, the Fermi telescope and other spacecraft detect an average of about one GRB each day. As to why this type of GRB hasn’t been detected before, Levan explained this new type appears to be difficult to find because of how long they last.

    “Gamma ray telescopes usually detect a quick spike, and you look for a burst — at how many gamma rays come from the sky,” Levan told Universe Today. “But these new GRBs put out energy over a long period of time, over 10,000 seconds instead of the usual 100 seconds. Because it is spread out, it is harder to spot, and only since Swift launched do we have the ability to build up images of GBSs across the sky. To detect this new kind, you have to add up all the light over a long period of time.”

    Levan is an astronomer at the University of Warwick in Coventry, England.

    He added that these long-lasting GRBs were likely more common in the Universe’s past.

    Image
    ^ The number, duration and burst class for GRBs observed by Swift are shown in this plot. Colors link each GRB class to illustrations above the plot, which show the estimated sizes of the source stars. For comparison, the width of the yellow circle represents a star about 20 percent larger than the sun. Credit: Andrew Levan, Univ. of Warwick.

    Traditionally, astronomers have recognized two types of GRBs: short and long, based on the duration of the gamma-ray signal. Short bursts last two seconds or less and are thought to represent a merger of compact objects in a binary system, with the most likely suspects being neutron stars and black holes. Long GRBs may last anywhere from several seconds to several minutes, with typical durations falling between 20 and 50 seconds. These events are thought to be associated with the collapse of a star many times the Sun’s mass and the resulting birth of a new black hole.

    “It’s a very random process and every GRB looks very different,” said Levan during the briefing. “They all have a range of durations and a range of energies. It will take much bigger sample to see if this new type have more complexities than regular gamma rays bursts.”

    All GRBs give rise to powerful jets that propel matter at nearly the speed of light in opposite directions. As they interact with matter in and around the star, the jets produce a spike of high-energy light.

    Gendre and his colleagues made a detailed study of GRB 111209A, which erupted on Dec. 9, 2011, using gamma-ray data from the Konus instrument on NASA’s Wind spacecraft, X-ray observations from Swift and the European Space Agency’s XMM-Newton satellite, and optical data from the TAROT robotic observatory in La Silla, Chile. The 7-hour burst is by far the longest-duration GRB ever recorded.


    Another event, GRB 101225A, exploded on December 25, 2010 and produced high-energy emission for at least two hours. Subsequently nicknamed the “Christmas burst,” the event’s distance was unknown, which led two teams to arrive at radically different physical interpretations. One group concluded the blast was caused by an asteroid or comet falling onto a neutron star within our own galaxy. Another team determined that the burst was the outcome of a merger event in an exotic binary system located some 3.5 billion light-years away.

    “We now know that the Christmas burst occurred much farther off, more than halfway across the observable universe, and was consequently far more powerful than these researchers imagined,” said Levan.

    Using the Gemini North Telescope in Hawaii, Levan and his team obtained a spectrum of the faint galaxy that hosted the Christmas burst. This enabled the scientists to identify emission lines of oxygen and hydrogen and determine how much these lines were displaced to lower energies compared to their appearance in a laboratory. This difference, known to astronomers as a redshift, places the burst some 7 billion light-years away.

    Levan’s team also examined 111209A and the more recent burst 121027A, which exploded on Oct. 27, 2012. All show similar X-ray, ultraviolet and optical emission and all arose from the central regions of compact galaxies that were actively forming stars. The astronomers have concluded that all three GRBs constitute a new kind of GRB, which they are calling “ultra-long” bursts.

    Image
    ^ Astronomers suggest that blue supergiant stars may be the most likely sources of ultra-long GRBs. These stars hold about 20 times the sun's mass and may reach sizes 1,000 times larger than the sun, making them nearly wide enough to span Jupiter's orbit. Credit: NASA's Goddard Space Flight Center/S. Wiessinger.

    Ultra-long GRBs arise from very large stars,” said Levan, “perhaps as big as the orbit of Jupiter. Because the material falling onto the black hole from the edge of the star has further to fall it takes longer to get there. Because it takes longer to get there, it powers the jet for a longer time, giving it time to break out of the star.”

    Levan said that Wolf-Rayet stars best fit the description. “They are born with more than 25 times the Sun’s mass, but they burn so hot that they drive away their deep, outermost layer of hydrogen as an outflow we call a stellar wind,” he said. Stripping away the star’s atmosphere leaves an object massive enough to form a black hole but small enough for the particle jets to drill all the way through in times typical of long GRBs.

    John Graham and Andrew Fruchter, both astronomers at the Space Telescope Science Institute in Baltimore, provided details that these blue supergiant contain relatively modest amounts of elements heavier than helium, which astronomers call metals. This fits an apparent puzzle piece, that these ultra-long GRBs seem to have a strong intrinsic preference for low metallicity environments that contain just trace amounts of elements other than hydrogen and helium.

    “High metalicity long duration GRBs do exist but are rare,” said Graham. “They occur at about 1/25th the rate (per unit of star formation) of the low metallicity events. This is good news for us here on Earth, as the likelihood of this type of GRB going off in our own galaxy is far less than previously thought.”

    The astronomers discussed their findings Tuesday at the 2013 Huntsville Gamma-ray Burst Symposium in Nashville, Tenn., a meeting sponsored in part by the University of Alabama at Huntsville and NASA’s Swift and Fermi Gamma-ray Space Telescope missions. Gendre’s findings appear in the March 20 edition of The Astrophysical Journal.

    Paper: “The Ultra-long Gamma-Ray Burst 111209A: The Collapse of a Blue Supergiant?” B. Genre et al.

    Paper: “The Metal Aversion of LGRBs.” J. F. Graham and A. S. Fruchter.

    Sources: Teleconference, NASA, University of Warwick, CNRS
Art will be the last bastion when all else fades away.
~ Timothy White (b 1952), American rock music journalist
_________________
User avatar
Allegro
 
Posts: 4456
Joined: Fri Jan 01, 2010 1:44 pm
Location: just right of Orion
Blog: View Blog (144)

New Kepler Planetary Systems in Images

Postby Allegro » Sat Apr 20, 2013 11:43 pm

Highlights mine.

_________________
Habitable Worlds? New Kepler Planetary Systems in Images
Universe Today, Nancy Atkinson | April 18, 2013

Image
^ Relative sizes of Kepler habitable zone planets discovered as of 2013 April 18. | Left to right: Kepler-22b, Kepler-69c, Kepler-62e, Kepler-62f, and Earth (except for Earth, these are artists’ renditions). Credit: NASA/Ames/JPL-Caltech.

    The Kepler mission has discovered two new planetary systems that include three super-Earth-size planets in the “habitable zone,” the range of distance from a star where the surface temperature of an orbiting planet might be suitable for liquid water.

    The Kepler-62 system has five planets; 62b, 62c, 62d, 62e and 62f. The Kepler-69 system has two planets; 69b and 69c. Kepler-62e, 62f and 69c are the super-Earth-sized planets. (Read all the details in our full article here.)

    The new planets brings the number of confirmed exoplanets to 861. According to the Planetary Habitability Laboratory, there are now nine potential habitable worlds outside of our solar system, with 18 more potentally habitable planetary candidates found by Kepler waiting to be confirmed. Additionally, astronomers predict there are 25 potentially habitable exomoons.

    Here is some of the imagery (sorry, but they are artists concepts!), graphs and video used in today’s briefing about the new discoveries, as well as some some from the Planetary Habitability Laboratory:

    Here’s a flythrough of the Kepler 62 system:


    Image
    ^ The diagram compares the planets of the inner solar system to Kepler-69, a two-planet system about 2,700 light-years from Earth. Image credit: NASA Ames/JPL-Caltech

    Image
    ^ Much like our solar system, Kepler-62 is home to two habitable zone worlds. The small shining object seen to the right of Kepler-62f is Kepler-62e. Orbiting on the inner edge of the habitable zone, Kepler-62e is roughly 60 percent larger than Earth. Image credit: NASA Ames/JPL-Caltech.

    Image
    ^ The diagram compares the planets of the inner solar system to Kepler-62, a five-planet system about 1,200 light-years from Earth. Image credit: NASA Ames/JPL-Caltech

    Image
    ^ Current known potentially habitable exoplanets. Credit: Planetary Habitability Laboratory/University of Puerto Rico, Arecibo.

    Image
    ^ Current potentially habitable exoplanets showing the new additions, Kepler-62e and Kepler-62f. Credit: Planetary Habitability Laboratory/University of Puerto Rico, Arecibo.

    Image
    ^ Comparison of the orbit and size of the exoplanets of Kepler-62 with the terrestrial planets of our Solar Systems. The darker green shaded area corresponds to the ‘conservative habitable zone’ while its lighter borders to its ‘optimistic habitable zone’ extension. Planet sizes and orbits are not to scale between them. Credit: Planetary Habitability Laboratory/University of Puerto Rico, Arecibo.


    ^ NASA’s Kepler Discovers Its Smallest ‘Habitable Zone’ Planets to Date
Art will be the last bastion when all else fades away.
~ Timothy White (b 1952), American rock music journalist
_________________
User avatar
Allegro
 
Posts: 4456
Joined: Fri Jan 01, 2010 1:44 pm
Location: just right of Orion
Blog: View Blog (144)

An Alien Solar System With Two Earth-Sized Worlds

Postby Allegro » Sun Apr 21, 2013 12:16 am

Highlights mine.

_________________
New Discovery:
An Alien Solar System With Two Earth-Sized Worlds | Phil Plait

Bad Astronomy | Thursday, April 18, 2013, at 2:00 PM

Image
^ "All these worlds…" of Kepler-62, as depicted by an artist. Click to enarthurcclarkenate. Image credit: David A. Aguilar (CfA)

    Scanning the heavens, you might very well miss the star Kepler-62. It’s a rather typical star, slightly smaller, cooler, and more orange than the Sun, much like tens of billions of other stars in our galaxy. But it holds a surprise: It’s orbited by at least five planets… and two of them are Earth-sized and orbit the star in its habitable zone!

    The two planets, called Kepler-62e and Kepler-62f, are both bigger than Earth, but not by much; they are 1.6 and 1.4 times the Earth’s diameter, respectively. Kepler-62e orbits the star every 122 days, while Kepler-62f, farther out, takes about 267 days.

    Given the temperature and size of the parent star, this means that both planets are inside the zone around the star where water on the surface could be a liquid. Now, to be clear, this depends on a lot of factors we don’t know yet: the masses of the planets, their compositions, whether they have atmospheres or not, and what those putative atmospheres are made of. For example, Kepler-62e could have a thick CO2-laden blanket of air, making its surface temperature completely uninhabitable, like Venus.

    Or it might not. We just don’t know yet, and won’t for quite some time—both planets are too small to get a measurement of their masses. It’s worth noting, though, that we do have size and mass determinations for a few planets like this around other stars, and they look rocky, like Earth. That makes it likelier these two planets are as well.

    Also, the best computer models we have, based on what we know about how planets form and change over time, indicate that these planets could very well have water on them (it is, after all, incredibly common both in our solar system and in the Universe at large). We’ve already seen at least one planet with indications of the presence of water.

    That’s pretty exciting. For years we didn’t know if any planets existed around other stars at all. When we started finding them all we could see were ones that were huge and hot, as unlike Earth as you can imagine. But as time went on, and our technology and techniques got better, we started finding smaller, less massive worlds. Now we are finding ones that look achingly like home.

    Image
    ^ Diagram depicting the
    geometry of an exoplanet
    transit. Adapted from a
    diagram by Greg Loughlin.
    These planets were found using the transit method: The Kepler spacecraft stares at one region of the sky, observing about 150,000 stars all the time. If a planet orbits a star, and the orbit is oriented edge-on from our point of view, we see the planet pass directly in front of the star once per orbit. This is called a transit, and it blocks a teeny bit of the star’s light. The amount of light blocked depends on the size of the star (which we can determine) and the size of the planet. A big planet blocks more light, and a small one less.

    That’s what makes finding Earth-sized planets hard; they only block about 0.01 percent of the star’s light. Kepler was designed to be sensitive enough to detect that meager dimming, though, and has actually found several planets in this size range now.

    The other problem is timing. For a planet to be in the star’s habitable zone, it may take months or even years for it to pass in front of the star several times (multiple transits are needed to make sure we’re not seeing some other event, like a starspot). That takes time, but Kepler has been observing these stars for years now, which is why we’re seeing more and more smaller planets now.

    And to find two orbiting the same star is very cool indeed. Assuming they’re made up of the same materials as Earth (metal and rock) and therefore have about the same density, you’d weigh 60 percent more on Kepler-62e, and 40 percent more on Kepler-62f. I’ll note that all things considered, neither would be paradise: Kepler-62e gets about 20 percent more sunlight than we do on Earth, and Kepler-62f gets about half; a bit hot and cold for my taste. But again, we don’t know the conditions on these planets. Give Kepler-62e a thin atmosphere, and Kepler-62f a thick one, and they might look a lot like Earth.

    Image
    ^ Artwork of a planet transiting
    its star’s face. Image credit:
    ESO/L. Calçada
    What an amazing thing that would be: two inhabitable worlds around one star (as opposed to all the Tatooines we’ve been finding)! It’s fun to imagine it being like a Victorian science fiction novel, spurring interplanetary travel and trade between alien races… or war. I guess that depends on which writer you read.

    Of course, the habitability of these two newly-found planets is all supposition, but consider this: We think there are tens of billions of Earth-sized planets orbiting other stars. Even if a fraction of them are the right distance to be in their stars’ habitable zones, that still leaves tens or hundreds of millions of planets. That’s a lot of planets to play with. Sure, some will be too hot, too cold, have too much air or not enough, or have toxic atmospheres. But still, statistically speaking, it seems very likely indeed that there are plenty of planets out there that will look an awful lot like Earth.

    I’m hopeful.

    One of the reasons we look out into the Universe is to learn more about ourselves. Certainly, finding planets that are different than ours provides us with context, a there-but-for-the-grace-of-God-go-we sort of perspective. It also teaches us a lot about how planets form and evolve. Scientifically, different is good.

    But we’re human, and we yearn to know if there are other worlds out there like ours. And if so, might life have arisen there as well? What a wonderful discovery that would be! And if not, it shows us how precious and rare life is.

    Either way, knowing the answer—once we find it—will be extraordinary.
Art will be the last bastion when all else fades away.
~ Timothy White (b 1952), American rock music journalist
_________________
User avatar
Allegro
 
Posts: 4456
Joined: Fri Jan 01, 2010 1:44 pm
Location: just right of Orion
Blog: View Blog (144)

Galaxy at the Edge of the Universe Really Likes Making Stars

Postby Allegro » Sun Apr 21, 2013 1:17 am

Highlights mine.

_________________
Galaxy at the Edge of the Universe Really Likes Making Stars | Phil Plait
Bad Astronomy | Thursday, April 18, 2013, at 8:00 AM

Image
^ The incredibly distant yet still huge and fertile galaxy HFLS3. Click to embiggen. Image credit: ESA/Herschel/HerMES/IRAM/GTC/W. M. Keck Observatory

    Stars are a bit like people: They are born, live out their existence, and die. In galaxies like our Milky Way, if you collected all the stars born every year you’d find they add up to very roughly the same mass as the Sun. Different studies yield different numbers, but they only vary from about one to about four times the mass of the Sun.

    Things were different when the Universe was young, though. New observations found a passel of galaxies churning out stars at the rate of 80 times the mass of the Sun every year. Not only that, but one distant galaxy was recently found that is cranking out newborns at the fantastic rate of about 3000 solar masses per year! This galaxy is almost literally exploding with star formation.

    We know lots of galaxies have high star-formation rates; we see a few locally, but we see more the farther away we look. Looking away in distance is like looking back in time, because it takes time for light to get from the galaxy to us. The actual physics is a bit complicated, but essentially we see a galaxy a billion light years away as it was a billion years ago. The Universe is 13.8 billion years old, and galaxies started forming shortly thereafter, so by looking at extremely distant galaxies we’re probing what the Universe was like at a very young age.

    The galaxy called HFLS3 was found using the orbiting Herschel observatory, which sees in the far infrared. Galaxies churning out stars also make lots of molecules we call dust; these clouds of dust absorb visible light but let infrared through. That makes them prime targets for Herschel.

    Combing through vast amounts of Herschel data, astronomers found five candidate ultra-red sources consistent with starburst galaxies, and one, HFLS3, was found to be distant indeed: they determined the distance is a whopping 13 billion light years away, meaning the Universe itself was only 800-900 million years old when the light we see left the galaxy
    .

    That actually is something of a problem. Current understanding of how stars form show that a galaxy at that young age shouldn’t be able to make them that vigorously! In fact, the galaxy appears to be almost as large as our Milky Way—about a hundred billion stars strong—which is incredible, given how short a time it had been around.

    That in turn means our models of star formation need some work. The galaxy is there, and it does appear to be incredibly fecund. If the current physical models have a hard time replicating it, then we need to figure out why. Maybe conditions that long ago aren’t exactly what we expect, and that affects the rate of star birth. Or maybe this galaxy is just weird in some way, and is a very rare beast, with some unusual characteristics that allow it to furiously cook stars.

    That’s actually good news; observations that strain the models mean we have to learn more, and scientists love that. It’s a weird profession, where finding out you’re wrong is cause for joy.

    Image
    ^ A handful of the 120+ galaxies observed by ALMA (red) overlaid on images of the same area using Spitzer Space telescope. The red galaxies are creating stars at astonishing rates. Click for the whole schmeer. Image credit: ALMA (ESO/NAOJ/NRAO), J. Hodge et al., A. Weiss et al., NASA Spitzer Science Center

    And we’re going to learn more. On top of the discovery of HFLS3, the brand-spanking-new radio observatory ALMA has some news of its own: It was pointed at an area of the sky known to contain starburst galaxies, and was able to clearly see over a hundred of them. Not only that, but ALMA is so sensitive it was able to make these observations needing only about two minutes per galaxy!

    ALMA observed a region of the sky called the Chandra Deep Field South, where several telescopes have spent quite a lot of time taking very long exposure images, peering very deeply into the Universe. We knew there were galaxies in that area making lots of stars, but our best observations showed them as fuzzy blobs, overlapping with nearer galaxies. ALMA has very sharp vision, however, and was able to separate out the starburst galaxies, getting nice clear shots of them. This will allow astronomers to draw far better conclusions about the galaxies themselves.

    The distances to these objects isn’t well known, but it’s likely they’re 10 or so billion light years, a long way off. Given that, they’re making something like 80 solar masses worth of stars per year, a pretty high rate. The galaxies themselves are smallish, or at least the regions in them making stars are, measured to be about 30,000 light years across, about a third the size of the Milky Way.

    All of this information will be useful in understanding how stars formed in the early Universe. Perhaps the ALMA observations will have a direct impact on how we can figure out HFLS3.

    This is all pretty cool. I’ve been an astronomer a long time, and every now and again I have to sit back and shake my head in wonder. We can take the measure of an object like HFLS3, even though it’s 130 billion trillion kilometers away—written out, that’s 130,000,000,000,000,000,000,000,000 kilometers!

    Yikes. Yet there it is, popping out stars furiously, making our galaxy look sedate and lazy by comparison. And with ALMA now online we’ll be able to analyze distant galaxies better, as well as a host of other exotic and fascinating objects like exploding stars, gas clouds, and hyperactive black holes blasting out huge jets of material.

    There’s been a lot of bad news lately when it comes to human affairs. But when I see news like this, I become optimistic. When we want to, when we choose to, our sight reaches clear across the cosmos, and we sift through the very material making up the Universe. We can peer back in time to the fires of the Big Bang, and determine how it is that conditions back then led to our existence now.

    These are the some of the biggest questions we can ask—How did the Universe form? Why is the something rather than nothing?—and it’s through curiosity, through sheer joy of exploration, and through science that we can find the answers.
Art will be the last bastion when all else fades away.
~ Timothy White (b 1952), American rock music journalist
_________________
User avatar
Allegro
 
Posts: 4456
Joined: Fri Jan 01, 2010 1:44 pm
Location: just right of Orion
Blog: View Blog (144)

Hubble’s Knight to Remember

Postby Allegro » Sun Apr 21, 2013 2:17 am

Highlights mine.

_________________
Hubble’s Knight to Remember | Phil Plait
Bad Astronomy | Friday, April 19, 2013, at 11:07 AM

    On April 24, 1990, the Hubble Space Telescope was launched into orbit, on its way to revolutionizing astronomy. This week marks the 23rd anniversary of that event, and to celebrate, astronomers released a devastating image of the iconic Horsehead nebula, a vast and dense cloud of gas and dust in Orion:

    Image
    ^ The Horsehead Nebula, a complex of gas and dust 1500 light years away in Orion. Click to enequuenate. Image credit: NASA, ESA, and the Hubble Heritage Team (STScI/AURA)

    Holy wow. Not only is that beautiful, it’s weird. I’m not used to seeing it this way.

    Image < The usual view of the Horsehead in visible light, looking a bit different. Click to embiggen. Image credit: T.A.Rector (NOAO/AURA/NSF) and Hubble Heritage Team (STScI/AURA/NASA)

    The Horsehead is superposed on a ridge of bright hydrogen gas, usually seen as a reddish-pink glowing sheet. Because the Horsehead is choked with dust, it’s opaque, and blocks the light from behind it. We see it in silhouette, dark against a bright background.

    But the Hubble image is in the infrared. That light, just outside of what our eyes can see, is better able to pierce through the dust. In the Hubble image we’re seeing more deeply into the Horsehead, seeing detail inside the cloud.

    So exactly what are we seeing? Just off the top of the Hubble picture is the bright star system Sigma Orionis, composed of five incredibly luminous stars. Combined, they shine with the power of over 75,000 Suns! They are responsible for heating and exciting the gas behind the Horsehead.

    The Horsehead itself is the site of ongoing star formation. The dense gas and dust inside the nebula is collapsing to form stars, and, at the same time, the edges are being eroded away by the fierce ultraviolet light of Sigma Orionis. The top of the Horsehead is acting a bit like a shield, protecting the material beneath it, which is why it’s taken on that umbrella-like shape. You can see more sculpted pillars of material around the sides, too, like sandbars in a stream. That’s pretty typical in situations like this
    .

    So the Horsehead is getting blasted from above by Sigma Orionis, which is slowly dissolving away the nebula. Eventually it will disappear, but that will take a few million years. And left behind in its passing will be a set of new, young stars, shining brightly, their light free to cross the cosmos.

    It’s all part of the natural cycle of the Universe: Structures come and go, sprawling clouds of gas and dust spawn stars from their own material that will take their place and eventually destroy them…but many of those stars will eventually explode and seed space with the elements and conditions that will help create the next generation of stars. We literally owe our existence to some long-gone nebula like the Horsehead, and to the stars that existed even before it.

    So appreciate the beauty of the Horsehead while it’s here, and it’s necessity when it’s gone.
Art will be the last bastion when all else fades away.
~ Timothy White (b 1952), American rock music journalist
_________________
User avatar
Allegro
 
Posts: 4456
Joined: Fri Jan 01, 2010 1:44 pm
Location: just right of Orion
Blog: View Blog (144)

Aeolian harp | von Karman vortex street effect

Postby Allegro » Sun Apr 21, 2013 10:35 am

RESOURCE
Highlights mine.

_________________
Blowin’ in the wind
Artist Burke Jam lets the sounds of nature take the reins
Missoula Independent, Erika Fredrickson | February 14, 2013

    Burke Jam spent the first part of graduate school experimenting with a harp. Not just any harp, but an Aeolian harp that can only be played by the wind. The instrument was first described in the late 1600s by a Jesuit scholar and was named after Aeolus, the Greek god of wind. Its strings are loose, so if it’s plucked by a person there is no sound. But when the wind blows through it, it begins to hum. The scientific term for the natural phenomenon is the “von Karman vortex street effect,” and it’s demonstrated in other situations, like when power lines vibrate during a gust. A person can adjust the harp’s string, but how it sounds is dictated by nature.

    Image
    Burke Jam
    A photograph by Burke Jam that will be used in his upcoming installation Sonification 1–3.

    “You can tune the strings to a certain key but the topography, the wind speed and direction, the vegetation—all of that affects how the wind moves through that environment, which in turn affects the sound of the harp,” Jam says.

    Jam is a Missoula artist and musician whose atmospheric shows—whether under his solo moniker, Churchmouse, or as a guitarist in bands like Scriptures—hint heavily at his penchant for sonic experimentation. He’s also been involved in Missoula’s alternative visual art scene, most recently as a curator for the back-alley gallery, Frontier Space, which often shows avant garde art installations that are sometimes kept secret until the day of exhibit.

    With the Aeolian harp experiment, Burke mapped out several arbitrarily chosen outdoor sites—some small as a room, others hundreds of miles wide—with a compass. He visited each cardinal and sub-cardinal point of the landscape, of which there are eight, just like notes in a scale. He recorded whatever music the wind made with the harp.

    “Each one would have a different sound and it would be indicated by the actual site itself,” he says. “If you play it all together, all of sudden you get chords.”


    Sound installations aren’t always the easiest thing to present to an audience. Jam created an audio piece recently where he walked the entire length of the Spiral Jetty and recorded what he heard. The Utah-based earthwork sculpture made in 1970 by the late Robert Smithson is meant to be seen, but Burke approached it another way. He recorded his footsteps, which provided an aural texture that’s surprisingly rich: you can hear him navigating over sand, rocks and crunchy salt crystals. You can also hear other sounds in the sky such as airplaines—Delta flights into Salt Lake City, mostly—and birds.

    During his time working toward an interdisciplinary master’s degree in the University of Montana’s Fine Arts program, Jam has amassed hours of field recordings. In his upcoming thesis show, The Shadow of Polaris: Understanding Sound and Place, he examines music made by certain natural objects. Besides some photographs, he’s keeping the main art installation under wraps so that viewers will be surprised when they walk in. But he promises that it will be both a visual and aural experience.

    As with all of his work, Polaris will involve natural elements. Jam says he’s interested in how sound affects the environment, especially when it comes to issues like fracking, climate change and pollution.

    “Most people who you ask on the street can tell you what fracking is,” Jam says. “But they don’t understand the amount of decibels and how powerful a sonic wave that it’s sending through the water. It literally kills huge amounts of sea life and it distorts migratory paths for salmon and whales.”

    His art pieces don’t take political sides. Instead, he weaves those issues into his installations in indirect ways.

    “It puts too narrow of a parameter on what I’m trying to ask my audience,” Jam says. “When you present a politic you run the risk of polarizing an audience. Sometimes that’s your job as an artist. But I just want people—whether from rural Montana or Brooklyn—to be able to walk into a gallery and experience the work I do and walk out with a set of questions.”

    On March 1, Jam will show another installation that also explores sound. Sonification 1–3, which he’ll show at the Music Recital Hall, uses panoramic photos he shot of natural landscapes around Montana. As the photos rotate, local band Stellarondo will play a literal interpretation of the images scored by Jam. He composed the music by using the outlines of clouds and mountains to dictate what notes the musicians should play.

    “They’re sight-reading the visual image the same way they’d read a staff of music,” he says. “To my mind music is just an object of sound. Sound is just a phenomenon like light.”


    With a master’s degree in hand, Jam has plans to explore more of his ideas in the area of natural acousticology. His next project will take him to Iceland, where he’ll spend two months recording sites across the country.

    “We are definitely a visual culture,” he says. “But for me, sound is fascinating. In the summer, when I’m not teaching or working in the studio, I’m smoke-jumping. In the woods, in the dark, you hear things before you actually see them.”

    The MFA Thesis show featuring The Shadow of Polaris opens at UM’s Gallery of Visual Arts in the Social Science Building Thu., Feb. 21, with a reception from 5 to 7 PM.
Last edited by Allegro on Sun Apr 21, 2013 10:53 pm, edited 2 times in total.
Art will be the last bastion when all else fades away.
~ Timothy White (b 1952), American rock music journalist
_________________
User avatar
Allegro
 
Posts: 4456
Joined: Fri Jan 01, 2010 1:44 pm
Location: just right of Orion
Blog: View Blog (144)

Sonification of Numerical Fluid Flow Simulations

Postby Allegro » Sun Apr 21, 2013 1:06 pm

RESOURCE

Proceedings of the 2001 International Conference on Auditory Display, Espoo, Finland, July 29-August 1, 2001

Abstract and Introduction | pdf 6 pp total

The Sonification of Numerical Fluid Flow Simulations
Edward Childs, Ph.D.
Dartmouth College
The Bregman Electronic Music Studio
Electro-Acoustic Music
Department of Music
6187 Hopkins Center
Hanover, NH 03755-3599, USA
Edward.Childs@dartmouth.edu

    ABSTRACT

    Computational Fluid Dynamics (CFD) software simulates fluid, air flow and heat transfer by solving the Navier-Stokes (N-S) equations numerically. Realistic 3-D engineering simulations typically yield the values of 7 or more variables (e.g. fluid component velocities and temperatures) at hundreds of thousands of points in space, all as a function of time. It has been noted that solutions of the N-S equations sometimes yield highly complex, non-linear flow fields which can be aesthetically interesting from a purely visual standpoint.

    The analysis of CFD results may benefit substantially from sonification, to depict convergence behavior, scan large amounts of data with low activity, or codify global events in the flow field. As a corollary to this interest in developing CFD sonification techniques, we can explore its unusual potential as a tool for algorithmic musical composition.

    This paper will report the results of an initial implementation of the author’s port of the two-dimensional, steady, laminar CFD code TEACH-L on a JAVA platform, in which the numerical output is linked in real time to the JSyn digital audio synthesis package. The sonification of steady, laminar, developing flow in a two dimensional duct will be described in detail.

    1. INTRODUCTION

    1.1. History
    The non-linear partial differential equations governing the conservation of mass, momentum and energy in fluids were derived from first principles in the first half of the 19th century by J. Navier [1] and G. Stokes [2]. Except for a few very restricted cases (e.g. fully-developed laminar flow in a duct), these equations could not be solved by analytical methods, and thus remained a mathematical curiosity until numerical methods on high speed computers became available in the second half of the 20th century [3]. During the past twenty years, general-purpose CFD software has emerged as a practical tool for applying the Navier-Stokes equations to the solution of realistic fluid flow problems in engineering and physics. Today, several commercial CFD packages are routinely used by engineers and scientists in such diverse fields as hyrdrodynamics, aerodynamics, biomedical engineering, process industry, heating, ventilating and air conditioning and environmental engineering to name a few.

    1.2. The CFD Process
    A typical CFD analysis is carried out in six stages:
      1. The complex, real-world situation to be analyzed is reduced to a practical CFD project based on:
        ⋅ The limitations of the CFD model being used.
        ⋅ The available time and computational resources.
        ⋅ Engineering judgment as to what details of the flow field are essential to the anlysis.
      2. The geometry of the region of interest is either imported from a CAD package or constructed from scratch in the CFD package. Imported geometries often contain details which are extraneous to the CFD analysis and must either be modified or removed.
      3. A computational grid is generated which must generally satisfy the following constraints:
        ⋅ The total number of grid points must not be so large as to overwhelm the limitations of CPU storage and speed.
        ⋅ The grid must be fine enough to resolve the details of the flow field which are of interest to the user.
        ⋅ The characteristics of the grid must be compatible with the solver: there can be no sudden changes in cell size and cells may not have too high an aspect ratio or be extremely skewed.
      4. Boundary conditions must be applied to all regions of the computational domain and the physical properties of the fluid(s) must be specified.
      5. Various solution control parameters and solver options must be set. The solver is then started and must be monitored until a converged solution is achieved.
      6. The results are then post-processed, sometimes within the CFD package itself, or else exported to a data visualization package.

    This cycle is often repeated several times before a final, satisfactory result is obtained.
Art will be the last bastion when all else fades away.
~ Timothy White (b 1952), American rock music journalist
_________________
User avatar
Allegro
 
Posts: 4456
Joined: Fri Jan 01, 2010 1:44 pm
Location: just right of Orion
Blog: View Blog (144)

Sonification | Multimedia Systems 1999

Postby Allegro » Sun Apr 21, 2013 10:54 pm

RESOURCE
Abstract, Introduction, Resources | pdf 9 pp total

Multimedia Systems 7: 23–31 (1999)
Multimedia Systems © Springer-Verlag 1999

Using sonification
Stephen Barrass1, Gregory Kramer2
1GMD IMK – German National Research Centre for Information Technology, Schloss Birlinghoven, D-53754 St. Augustin, Germany; e-mail: stephen.barrass@gmd.de
2Clarity/Santa Fe Institute, 310 NW Brynwood Lane, Portland, OR 97229, USA; e-mail: kramer@listen.com

    Abstract.
    The idea behind sonification is that synthetic non-verbal sounds can represent numerical data and provide support for information processing activities of many different kinds. This article describes some of the ways that sonification has been used in assistive technologies, remote collaboration, engineering analyses, scientific visualisations, emergency services and aircraft cockpits. Approaches for designing sonifications are surveyed, and issues raised by the existing approaches and applications are outlined. Relations are drawn to other areas of knowledge where similar issues have also arisen, such as human-computer interaction, scientific visualisation, and computer music. At the end is a list of resources that will help you delve further into the topic.

    Key words: Sonification – Visualisation – Multi-modal – Multimedia – Perceptual display – Human-computer interaction – Information design – Auditory display

    Introduction
    A “nano-guitar” the size of a single cell, with strings that actually vibrate, has been built by physicists at Cornell University (Craighead 1997). It could be a miracle cure – all we have to do is inject nano-guitars into the bloodstream of a sick person so the bacteria form garage bands that can be tracked down with a stethoscope. The nurses might need earplugs in the intensive care ward!

    The idea of using sounds to diagnose illnesses, and even save lives, is not speculative or even unusual in hospital, where a stethoscope is a normal part of a doctors equipment. Medical students are taught to listen to tissues rubbing in the lungs, gasses bubbling in the intestines, and blood pumping through veins. Many other indicators, such as body temperature or blood CO2 levels, are measured and shown as graphs. However, a graph can be distracting during visually demanding tasks in an operation, and it is possible to synthesise sounds to represent these indicators instead. Medical students performed better in a simulated operation when eight dynamic variables about the health of the patient were presented as sounds rather than graphs, and better with sounds alone than with both sounds and graphs combined (Fitch and Kramer 1994). Images produced by X-ray, Cat scans and magnetic resonance imagery (MRI) equipment are often used to look for symptoms of disease inside a patients body. However, it is very difficult to visually detect unhealthy regions of the brain in an MRI image, because of the nature of brain tissue. Unhealthy regions of the brain can be made more distinguishable by mapping image texture into sounds that can be heard by selecting a region of interest with a mouse (Martins et al. 1996). Listening to the data may help a doctor to diagnose a dangerous illness which might otherwise go undetected.

    Medicine is not the only area where sounds can provide new insights into data relations and allow new and better ways to carry out a task. The next section describes a variety of other situations where sonifications have been tried and found to be useful.

    < snip >

    Resources
    If you are interested in sonification a good place to start delving further is the web site of the International Community for Auditory Display (ICAD) <http://www.santafe.edu/icad>.

    ICAD is a forum for presenting research on the use of sound to display data, monitor systems, and provide enhanced user interfaces for computers and virtual reality systems. It is unique in its singular focus on auditory displays and the array of perception, technology, and application areas that this encompasses.

    A history of sonification and the papers from the inaugural ICAD conference are contained in the book “Auditory Display, Sonification, Audification, and Auditory Interfaces” (Kramer 1994b).

    Many examples of useful sonification can be found in the proceedings of the ACM Conference on Assistive Technologies (ASSETS) <http://www.acm.org/sigcaph/conferences/>.

    ACM SigSound provides a page of links <http://datura.cerl.uiuc.edu/netstuff/sigsoundLinks.html> to DSP, auditory research, computer music, sonification demos, organisations, courses of study and many other sound-related resources.

    The Acoustic Society of America (ASA) is a scientific society dedicated to increasing and diffusing the knowledge of acoustics and its practical applications, and is a good place to find fundamental research on psychoacoustics <http://asa.aip.org>.

    Tools for handling sounds in new ways, the perception of sounds in virtual reality, and musical aesthetics are topics in the Computer Music Journal <http://mitpress.mit.edu/e-journals/Computer-Music-Journal/>. Sound perception, art and culture are topics of the Journal of Organised Sound <http://www.cip.cam.ac.uk/Journals/JNLSCAT95/oso/oso.html>, Leonardo the journal of the International Society for the Arts, Sciences and Technology <http://mitpress.mit.edu/e-journals/Leonardo/>, and SoundSite the online journal of Sound Theory, Philosophy of Sound and Sound Art <http://sysx.apana.org.au/soundsite/>
Art will be the last bastion when all else fades away.
~ Timothy White (b 1952), American rock music journalist
_________________
User avatar
Allegro
 
Posts: 4456
Joined: Fri Jan 01, 2010 1:44 pm
Location: just right of Orion
Blog: View Blog (144)

15 Facts About Our Planet for Earth Day

Postby Allegro » Mon Apr 22, 2013 10:49 am

Remembering Earth day, and happy there is one :)

_________________
15 Facts About Our Planet for Earth Day | Phil Plait
Bad Astronomy | Monday, April 22, 2013, at 8:00 AM

Image
^ Our lovely and fragile home. Click to engaiaenate. Image credit: ESA ©2009 MPS for OSIRIS Team MPS/UPD/LAM/IAA/RSSD/INTA/UPM/DASP/IDA

    Today, Apr. 22, is Earth Day, a time to appreciate our planet and the two-way relationship we have with it. It’s easy to take Earth for granted, since we see it every day. It becomes—it is—part of life’s background.

    But when you see the world through the eyes of science, nothing is mundane. We live on the surface of this great giant space-borne water-laden spinning rock, separated from the rest of the Universe beneath a thin veil of nitrogen and oxygen molecules. Even though you’re immersed in its influence, what do you really know about the Earth?

    Here are some Earth Day facts about our planet for you to ponder today. All 23 hours 56 minutes and 4.091 seconds of it, that is.

    1) There are a lot of different ways to measure how long it takes the Earth to go around the Sun, but if you say it takes pi x 10 million seconds, you’ll only be off by a half a percent.

    2) The Earth has a volume of about one trillion cubic kilometers. Can you picture a cube 1000 meters high, 1000 meters deep, 1000 meters across? Now picture a trillion of them. That’s the Earth.

    Image
    ^ Actually, if you were that big,
    it would be easy. Image credit:
    Shutterstock/iluistrator
    3) The Earth has a mass of 6,000,000,000,000,000,000,000,000 kilograms, or, if you prefer, 6 sextillion tons. In pounds, that’s actually…0. Nothing. Mass is a measure of how much stuff an object contains, but weight is how hard gravity pulls on that mass. The Earth is in space, orbiting the Sun, so it’s in freefall. It has mass, but no weight at all.

    4) The Earth isn’t a perfect sphere. It spins, so it’s a flattened at the poles a little bit. The diameter through the poles is 12,713.6 kilometers (7882.4 miles), but it’s 12,756.2 kilometers (7908.8 miles) through the equator. That difference of 43 kilometers is only about 0.3 percent, though, so really we’re pretty close to a perfect sphere.

    5) Not only is it flattened, but the gravitational forces of the Sun and Moon (what we call tides) distort its shape even more, pulling bulges out from it. The Earth is lumpy! Out in the deep ocean, the bulge of water due to the Sun and Moon can have an amplitude (change in height from minimum to maximum) of about a meter (40 inches). The solid Earth deforms due to the tides, too, with an amplitude of roughly 50 centimeters (20 inches). Even the air is affected by tides; though there are several factors that greatly complicate it (like expansion due to heating from the Sun during the day, and, simply, weather).

    6) There is no physical place where Earth’s atmosphere stops and space begins; the air just gets thinner and thinner and eventually fades away. But we love definitions, so the official height above the Earth’s surface considered to be where space begins—called the Kármán line—is at an altitude of 100 km. Anyone who gets higher than that is considered an astronaut.

    7) The Moon’s radius is about 1/4 that of the Earth’s, making it the largest satellite compared to its parent planet. Charon, Pluto’s biggest moon, is about half the diameter of Pluto itself. So if you don’t consider Pluto a planet, the Earth and Moon win.

    Image
    ^ The Moon is so small in the sky it’s actually difficult to photograph without a good telephoto lens. Image credit: Phil Plait

    Eight) The Moon is farther away from Earth than you think. As an analogy, if the Earth were a basketball, the Moon would be the size of a tennis ball 7.4 meters (24 feet) away.

    9) The Earth’s atmosphere is only transparent to a narrow slice of the electromagnetic spectrum. What we call visible light (mostly!) gets through, but most flavors of infrared, ultraviolet, X-rays and gamma-rays are stopped cold. Those last few are dangerous to life as we know it, so that works out well. But it’s not a coincidence: if our air didn’t protect us, we’d have evolved differently!

    10) The Earth is warming up. It’s a fact. Deal with it.

    Image
    ^ Manicouagan impact crater
    in Canada, seen from space.
    Image credit: NASA
    11) Fewer than 200 impact craters have been cataloged on Earth. The Moon has billions. We’d have just as many, but our air and water erode them over time, erasing them. Old craters on the Earth are hundreds of millions of years old; on the Moon those would be considered young.

    12) An asteroid, 2010 TK7, shares an orbit with the Earth. It’s about 300 meters (1000 feet) across, and never gets close enough to us to be a danger.

    13) The Earth orbits the Sun on an ellipse. The shape changes slightly over time due to the influence of the other planets, but on average the closest we get to the Sun (perihelion) is about 147.1 million kilometers (91.3 million miles) and the farthest (aphelion) about 152.1 million kilometers (94.3 million miles). That difference is only about 3 percent, which by eye is very nearly a perfect circle.

    Image
    ^ Earth’s water collected into a
    single drop. Image credit: Jack
    Cook/WHOI/USGS
    14) If you took all the water on Earth and collected it into a single drop, it would be just less than 1400 kilometers (860 miles) across.

    15) The Earth’s atmosphere weighs 5 quintillion kilograms, or 5000 trillion tons! You can do this math yourself: Weight is equal to pressure times area. Atmospheric pressure on the Earth’s surface is about 1 kilogram per square centimeter. Multiply that by the number of square centimeters on the Earth’s surface and you get the weight of all that air. Hint: The area of a sphere is 4 x π x radius2. [Note: Yes, I know kilograms are a mass and not a weight. Read this before you rant in the comments, please.]

    And a bonus, because it’s important:

    16) The Earth is the only place in the entire Universe where we know that life exists. But that won’t be true forever.

    To us, our Earth seems huge, solid, tailor-made for us, and permanent. But that is just one perspective, born of living on its surface. From a different perspective, none of those things is true. Seen from space, it looks much less unbreakable. Seen from deep space it shrinks to nothing more than a dot, barely visible in the reflected light of the Sun. From another star, even seeing our planet at all would be a colossal task. We are, after a monumental effort spanning decades, only just now finding other planets orbiting other stars.

    Is any like Earth? Almost certainly, and in fact there may be billions of planets like ours orbiting alien stars. But while they are like ours, they aren’t ours. As with any individual, our world is unique, and precious, and wonderful. Let’s keep it that way.

    Image
    ^ The Earth, a pale blue dot, seen from over 6 billion km away by the Voyager 1 spacecraft. From that distance, it was far less than a single pixel wide. Image credit: NASA/JPL

    If you liked these facts, I spent a year writing daily astronomy and space factoids which I’ve collected in my BAFacts Archive.
Art will be the last bastion when all else fades away.
~ Timothy White (b 1952), American rock music journalist
_________________
User avatar
Allegro
 
Posts: 4456
Joined: Fri Jan 01, 2010 1:44 pm
Location: just right of Orion
Blog: View Blog (144)

Bright Blazar’s Emission Defies Explanations

Postby Allegro » Tue Apr 23, 2013 1:08 am

Highlights mine.

_________________
Bright Blazar’s Emission Defies Explanations
Universe Today, Tammy Plotner | April 18, 2013

Image
^ Artist’s concept of the Hubble Space Telescope viewing ultraviolet light from the jet of the active galactic nucleus of PKS 1424+240. Clouds of hydrogen gas along the line of sight absorb the light at known frequencies, allowing the redshift and distance of each cloud to be determined. The most distant gas cloud determines the minimum distance to PKS 1424+240. Data from the Fermi Gamma-ray Space Telescope, shown on the horizon at the left, were also used for this study. (Image composition by Nina McCurdy, component images courtesy of NASA)

    When it comes to sheer wattage, blazars definitely rule. As the brightest of active galactic nuclei, these sources of extreme high-energy gamma rays are usually associated with relativistic jets of material spewing into space and enabled by matter falling into a host galaxy’s black hole. The further away they are, the dimmer they should be, right? Not necessarily. According to new observations of blazar PKS 1424+240, the emission spectrum might hold a new twist… one that can’t be readily explained.

    David Williams, adjunct professor of physics at UC Santa Cruz, said the findings may indicate something new about the emission mechanisms of blazars, the extragalactic background light, or the propagation of gamma-ray photons over long distances. “There may be something going on in the emission mechanisms of the blazar that we don’t understand,” Williams said. “There are more exotic explanations as well, but it may be premature to speculate at this point.”

    The Fermi Gamma-ray Space Telescope was the first instrument to detect gamma rays from PKS 1424+240, and the observation was then seconded by VERITAS (Very Energetic Radiation Imaging Telescope Array System) – a terrestrially based tool designed to be sensitive to gamma-rays in the very high-energy (VHE) band. However, these weren’t the only science gadgets in action. To help determine the redshift of the blazar, researchers also employed the Hubble Space Telescope’s Cosmic Origins Spectrograph.

    To help understand what they were seeing, the team then set a lower limit for the blazar’s redshift, taking it to a distance of at least 7.4 billion light-years. If their guess is correct, such a huge distance would mean that the majority of the gamma rays should have been absorbed by the extragalactic background light, but again the answers didn’t add up. For that amount of absorption, the blazar itself would be creating a very unexpected emission spectrum.

    “We’re seeing an extraordinarily bright source which does not display the characteristic emission expected from a very high-energy blazar,” said Amy Furniss, a graduate student at the Santa Cruz Institute for Particle Physics (SCIPP) at UCSC and first author of a paper describing the new findings.

    Bright? You bet. In this circumstance it has to over-ride the ever-present extragalactic background light (EBL). The whole Universe is filled with this “stellar light pollution”. We know it’s there – produced by countless stars and galaxies – but it’s just hard to measure. What we do know is that when a high-energy gamma ray photo meets with a low-energy EBL photon, they essentially cancel each other out. It stands to reason that the further a gamma ray has to travel, the more likely it is to encounter the EBL, putting a limit on the distance to which we can detect high-energy gamma ray sources. By lowering the limit, the new model was then used to “calculate the expected absorption of very high-energy gamma rays from PKS 1424+240”. This should have allowed Furniss’ team to gather an intrinsic gamma-ray emission spectrum for the most distant blazar yet captured – but all it did was confuse the issue. It just doesn’t coincide with expected emissions using current models.

    “We’re finding very high-energy gamma-ray sources at greater distances than we thought we might, and in doing so we’re finding some things we don’t entirely understand,” Williams said. “Having a source at this distance will allow us to better understand how much background absorption there is and test the cosmological models that predict the extragalactic background light.”

    Original Story Source: University of California Santa Cruz News Release. For further reading: The Firm Redshift Lower Limit of the Most Distant TeV-Detected Blazar PKS 1424+240.
Art will be the last bastion when all else fades away.
~ Timothy White (b 1952), American rock music journalist
_________________
User avatar
Allegro
 
Posts: 4456
Joined: Fri Jan 01, 2010 1:44 pm
Location: just right of Orion
Blog: View Blog (144)

Sonification | Brownian motion

Postby Allegro » Tue Apr 23, 2013 7:43 am

RESOURCE

Of the many sonifications I’ve listened to, the mp3 produced from Brownian motion of tiny particles is particularly good; it’s embedded under the subheader Music of the Spheres in the article of origin but not in the copy, below. I like the sonification because the simplicity of sounds chosen by the sonifier, and the inherent rhythms allowed to be clearly heard by the ensemble of movements of particles, combine to create an enjoyable few minutes. Also, I appreciate that a pop rhythm track wasn’t added, at least in the mp3 presented. There’s my bias showing :), again.

The article I thought was well written, perhaps by someone who was thoughtful enough to use only musical and scientific terms to imply a point without going too far in a description, and hence appearing as knowledgeable as readers who are already knowledgeable in music, for instance. Highlights mine, as usual.

_________________
Music from tiny particles’ movements set to debut
By Jason Palmer | Science and technology reporter, BBC News
19 September 2012 Last updated at 21:26 ET

Image
^ Mark Fell (l) collaborated with Jonathan Howse to turn “Brownian motion” into music

    The random dance of tiny particles bouncing around in liquid has been turned into a unique sound display.

    The jostling molecules of liquid bump the particles to and fro in an effect called Brownian motion.

    Now a chemical engineer and an artist have joined forces to turn this random molecular dance into music.

    The project, called Scale Structure Synthesis, was developed for the University of Sheffield’s Festival of the Mind, which begins on Thursday.

    The festival will see a number of pairings of science specialists with non-specialists in the name of public engagement, alongside talks, exhibitions and demonstrations.

    Music of the spheres

    For Scale Structure Synthesis, Jonathan Howse of the University of Sheffield built a simple microscope to observe the “musicians” of the installation: tiny particles of polystyrene, spheres just a millionth of a metre across, floating around in liquid.

    A microscope with a camera attached is fixed on the particles as Brownian motion pushes them back and forth, and computer software tracks the motions of up to eight of the particles.

    Artist Mark Fell then turns this stream of data into molecular music.

    The sounds come from eight separate speakers, one assigned to each tracked particle. The pitch of the sound from each speaker changes with the distance a given particle moves, while the timbre or character of the sound changes with the angle of the movement.

    The results make for interesting listening, Mr Fell said.

    The piece we’re doing could be thought of as quite confrontational,” he told BBC News. “It’s not nice, drifty, atmospheric kind of soundscapes, it’s quite pure, resonant, frequencies. Aesthetically it could be quite challenging.”

    “It’s not like I’m trying to induce any kind of feeling or specific response
    , my hope is that it’s aesthetically out of what people might normally encounter and prompts some kind of curiosity.”

    Dr Howse said that the project allowed a unique connection with the microscopic world.

    “These things we’re looking at are really, really small and you don’t interact with them, you only ever see them down the end of a microscope,” he told BBC News. “Making something bigger with it will be quite interesting.”

    But the connection is also to phenomena that are important in the real world.

    “The way particles behave in solution is hugely important, from industrial processes to drug delivery - that’s why I deal with particle technology. There will be some weird sounds coming out but also it’s underpinned by science.”
Art will be the last bastion when all else fades away.
~ Timothy White (b 1952), American rock music journalist
_________________
User avatar
Allegro
 
Posts: 4456
Joined: Fri Jan 01, 2010 1:44 pm
Location: just right of Orion
Blog: View Blog (144)

A Hundred Billion Star Trails Over Australia

Postby Allegro » Thu Apr 25, 2013 2:17 am

Links in original.

_________________
A Hundred Billion Star Trails Over Australia | Phil Plait
Bad Astronomy | Tuesday, April 23, 2013, at 1:41 PM

    Astrophotographer Mike Salway has a good eye for the sky. A while back, I featured his amazing picture of a lighthouse set against the Milky Way, and now he’s done it again. He attended a star party in New South Wales, Australia, and took several simply stunning pictures of the night sky.

    This first one is a 20-minute time exposure, allowing the stars to move across the sky during the shot:

    Image
    ^ Stars, clouds, and the Milky Way streak over Australia. Click to diurnalenate. Photo courtesy of Mike Salway, used by permission.

    He used a wide-angle 14 mm lens, which is why the sky is a bit distorted. But the colors! Clouds moving across the field of view created the odd, orange streaks. And the blur moving diagonally across the frame is the Milky Way itself, the combined light of a hundred billion stars.

    Even in this long exposure, some features are obvious, like the dark hole of the Coalsack (above the tree), a thick cloud of molecular gas and dust about 600 light-years away. The bright streaks to the upper left of the Coalsack are from Crux, the Southern Cross, and just above the tree are two bright streaks from Alpha and Beta Centauri. Alpha Cen is the closest star system to Earth, only 4.3 light-years away, and was recently found to have an Earth-sized planet orbiting one of the stars in this triple system.

    To the right you see the stars make smaller and smaller arcs as you close in on the pole of the sky. But remember: This is Australia, so that's the southern pole, not the northern one! You won't find Polaris or the Big Dipper here.

    Another jaw-dropper he took shows the Milky Way behind a copse of trees:

    Image
    ^ The glory of our galaxy spread across the sky. Oh yes, you want to click to embiggen this. Photo courtesy of Mike Salway, used by permission.

    That’s beautiful. Incredibly, it’s a 30-second exposure—the night sky there must be dark—and you can see amazing detail in the Milky Way. Dust cloud filigrees line the central bulge of our galaxy, clusters of stars are scattered about, and the bright pink cloud is the Lagoon Nebula, a site of active star formation 4,000 light-years away. The Lagoon is big and bright enough to see even in small telescopes, and I’ve observed it many times myself … as have much larger telescopes: I have more images of it here, here, and (a little more whimsically) here.

    Can you see the faint red and blue fuzziness just below and to the left of the Lagoon? That’s the Trifid Nebula, another favorite for small telescopes, and well worth a deeper look. It’s gorgeous.

    By the way, Salway made a version of this you can use as computer wallpaper, too. You’re welcome.

    Salway took these shots attending the IceInSpace Astrocamp star party, which was in mid-April 2013. If you live anywhere near Sydney and need time away from the city to get out under the stars, this looks like a pretty good way to go about it.
Art will be the last bastion when all else fades away.
~ Timothy White (b 1952), American rock music journalist
_________________
User avatar
Allegro
 
Posts: 4456
Joined: Fri Jan 01, 2010 1:44 pm
Location: just right of Orion
Blog: View Blog (144)

PreviousNext

Return to General Discussion

Who is online

Users browsing this forum: No registered users and 8 guests