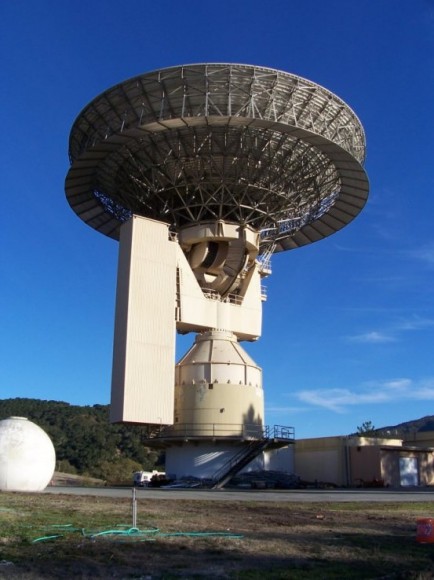
VIMEO NOTES. With the coldest March in 50 years in the UK, I filmed the magnificent Lovell radio telescope at the Jodrell Bank. It was build in 1955 and is the third biggest of its kind.
I recorded this with a Canon 60D using Magic Lantern and Cinema Picture Profile. Edited in Premiere Pro, After Effect and the music was composed using Acid Pro, Reason, LA Strings and Absynth.
Art will be the last bastion when all else fades away. ~ Timothy White (b 1952), American rock music journalist _________________
In this and the two following spaces are sonifications by Mark Ballora. He sonifies without adding extraneous sounds, noises or rhythm tracks to bother the listening via one’s ears and brain; and, if he’s added some spice to his work, he tells us. In his notes, he defines how he’s composed the sonification, but his explanations pass over my head as fast as neutrinos on their laziest afternoons .
Anyway, it appears Ballora is fastidious with his work in sonifying elements of the universe’s evolution. Although I’m fascinated with Domenico Vicinanza’s sonifications, Vicinanza and Ballora create out of different purposes, thus their sonified interpretations from numerical data or data visualizations are interestingly different, and, from their works I’ve listened to, I’ve thought enjoyable. Both sonifiers are masterful in their own right, I’d say.
I’m guessing each time you listen to a skillful sonification, the more sounds you’ll trust you’re hearing—in tonal scales humans are able to distinguish, naturally.
^ Sonification (Illustrative) of helioseismic L-NU diagram Published on Feb 20, 2013
YOUTUBE NOTES. The sun’s resonant vibrations are commonly shown on an l-nu diagram like this one shown below. The horizontal axis shows the harmonic degree number, horizontal vibratory nodes, from 0 to about 350. The vertical axis shows resonant frequencies. The yellow level shows intensity at various frequencies as the number of horizontal nodes increases. While lower numbers of harmonics produce widespread low intensity vibrations, once the number of horizontal nodes gets to about ten, clear resonant frequency patterns can be observed. As the degree number increases, moving to the right, regular high-intensity vibrations can be observed. The patterns of resonant frequencies form arc-like shapes as they are plotted more to the right.
A pitch envelope is created for each arc. This is used to control a spectrally rich drone, which traces the contour of the arc. A resonant bandpass filter is applied at the area of the third octave in an attempt to add some “yellow” to the sound at the resonant frequency. The frequency range of the plot, from 0 to 5000 Hz, is translated into a pitch range of five octaves. The fundamental frequency I chose is 45.7 Hz, which is the sun’s characteristic frequency (3 mHz) transposed down 16 octaves.
Image: soi.stanford.edu Sonification: Mark Ballora Data: gong.nso.edu
Art will be the last bastion when all else fades away. ~ Timothy White (b 1952), American rock music journalist _________________
^ CrabPulsar soundtrack16bit Published on Feb 20, 2013
YOUTUBE NOTES. The frequencies in GHz are transposed down to frequencies in Hz, with the relationship between partials maintained. Each frequency is divided by a billion, and then multiplied by 500.
For example, the intensity values for 1.408 GHz are rendered at a frequency of 1.408 times 500 (704 Hz).
The values are looped so that the data cycles repeat continually. The time treatment causes the pulses to be played in “slow motion,” occurring over approximately 9 seconds (as opposed to the actual time of 0.03 seconds).
Amplitude envelopes trace the data values. The data values are at very different scales. For example, the maximum value in the file for 0.408 GHz is close to 2500, while the maximum value in the file for 4.885 GHz is close to 0.5. Since the website with the pulsar data files says that these are “arbitrary units,” I simply normalized all values to fall within 0 and 1, so that, when applied to amplitude, the data points represent values between 0% and 100% of the available amplitude level.
A sine-like tone plays a transposition of each frequency, with amplitude controlled by an envelope, the levels of which correspond to the radius values. In addition to this “melody,” each dataset also has a secondary mapping of a sine-like tone transposed two octaves below the “melody” tone. The “undertone” does not change amplitude, which causes it to remain a constant rumble, with the “melody” tone fading in and out above it. The “undertone” is detuned so that it beats. The beating rate, as well as the frequency bandwidth of the “undertone,” are mapped from the zenith values. The stereo pan position of the “undertone” is mapped from the azimuth values.
^ Cosmic Microwave Background radiation sonification Published on Feb 20, 2013
YOUTUBE NOTES. The power spectrum is remapped to create the sonification. Values for power (y axis) as a function of wavelength (x axis) were transformed into values for frequency (y axis) as a function of time (x axis).
The contour of the spectrum is heard as a sound cloud. Numerous values are rendered per second, as the file is iterated automatically. The renderings should enable untrained listeners to hear salient spectral events, such as increased power at a certain wavelength, as a clear pitch sweep or jump. The frequency range in each rendering was chosen through trial and error. I chose a scale that seemed to effectively auralize the shapes in the plots.
There are two sound events rendered for each data point: • The first is a Shimmer, cymbal-like sound, with the “pitchiness” related to the mapped frequency value at the current data point. • The second is a Dust sound, created by putting noise through a bandpass filter with center frequency at the mapped frequency value at the current data point.
Time-Lapse: The Rise of the Milky Way | Phil Plait Bad Astronomy | Thursday, June 13, 2013, at 12:06 PM
^ About 100 billion stars loom over the telescopes at the Paranal Observatory in Chile. Video screenshot courtesy of Stéphane Guisard
Here it is, your moment of Zen: the Milky Way rising majestically over the Paranal Observatory in Chile.
This time-lapse video was taken by Stéphane Guisard, whose photos have been seen on this blog many times before (see Related Posts, below). Guisard used a wide-angle fish-eye lens to capture the whole sky. Around the bottom are the various telescopes comprising the Very Large Telescope array (each an 8.2-meter behemoth), and you can see the domes moving as they target various astronomical objects.
The Milky Way steals the show here. We live in a vast disk galaxy, 100,000 light-years across. But we’re not in the center; we’re very roughly halfway from the center to the edge of the disk. That means when we look toward the constellation of Sagittarius, we are looking toward the center of the galaxy—like someone who lives halfway to the northern edge of Manhattan can face south to look “downtown.”
The central bulge of the galaxy rises right to the zenith, and the flat disk, seen edge-on, bends due to the weird optical effect of the lens Guisard used. The disk is littered with gas clouds and spotted with darker clouds of thick dust that block the light of stars behind them.
Two satellite galaxies, the Large and Small Magellanic Clouds, rise to the upper left as airplanes streak across the frame. My favorite part, though, is right at the end, when coming in from the upper right you can see a faint shaft of light pointing toward the center of the frame. That’s zodiacal (pronounced Zo-DIE-ah-cull) light, sunlight reflected by dust shed from comets in the solar system. Like the Milky Way itself, those particles form a flat disk that we see edge-on, so it looks like a line across the sky. It’s very faint, and you need really dark skies to spot it at all.
I’ve never been to Paranal, but someday I hope I will. I can only imagine how incredible the view must be from down there.
_________________ Lone Signal: First Continuous Message Beacon to Find and Say Hello to an Extraterrestrial Civilization Universe Today, Nancy Atkinson | June 12, 2013
^ The Jamesburg Earth Station radio dish in Carmel, California will be used to send the Lone Signal messages to space. Image via Lone Signal.
Although scientists have been listening for years to search for indications of other sentient life in the Universe, just a few efforts have been made by humans to purposefully send out messages to the cosmos. Called METI (Messaging to Extraterrestrial Intelligence) or Active SETI (Search for Extraterrestrial Intelligence), these messages have so far been just one-time bursts of info – or “pulses in time” said Dr. Jacob Haqq-Misra.
Haqq-Misra is leading a team of scientists and entrepreneurs who are launching a new initiative called “Lone Signal” which will send the first continuous mass “hailing messages” out into space, starting later this month. They’ll be specifically targeting one star system, Gliese 526, which has been identified as a potentially habitable solar system.
And yes, the general public can participate.
“From the start we wanted to be an experiment where anyone on Earth could participate,” said Haqq-Misra during a press event on June 11, 2013, announcing the project.
“Our scientific goals are to discover sentient beings outside of our solar system,” said Lone Star co-founder Pierre Fabre, also speaking at the event. “But an important part of this project is to get people to look beyond themselves and their differences by thinking about what they would say to a different civilization. Lone Signal will allow people to do that.”
Lone Signal will be using the recommissioned radio dish at the Jamesburg Earth Station in Carmel, California, one of the dishes used to carry the Apollo Moon landings live to the world.
Timelapse of the Jamesburg Earth Station
Lone Signal will be sending two signals: one is a continuous wave (CW) signal, a hailing message that sends a slow binary broadcast to provide basic information about Earth and our Solar System using an encoding system created by astrophysicist and planetary scientist Michael W. Busch. The binary code is based on mathematical “first principles” which reflect established laws that, theoretically, are relatively constant throughout the universe; things like gravity and the structure of the hydrogen atom, etc.
“This hailing message is a language we think could be used to instigate communication,” said Haqq-Misra, “and is the most advanced binary coding currently in use.”
The second signal, embedded in the first signal, will be messages from the people of Earth.
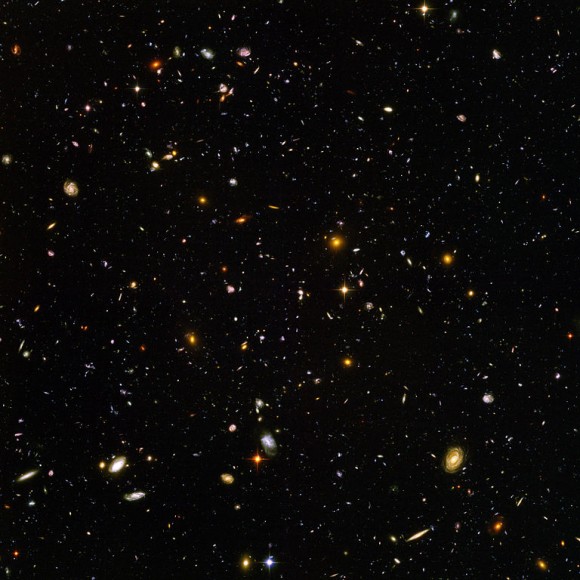
^ A new study of distant galaxies like those shown in this image from the Hubble Space Telescope, uses the new ‘stacking’ technique to gather information only available through radio telescope observations. Credit: NASA, STScI, and ESA.
Very similar to stacking astronomy images to achieve a better picture, researchers from the International Centre for Radio Astronomy Research (ICRAR) are employing new methods which will give us a clearer look at the history of the Universe. Through data taken with the next generation of radio telescopes like the Square Kilometer Array (SKA), scientists like Jacinta Delhaize can “stack” galactic signals en masse to study one of their most important properties… how much hydrogen gas is present.
Probing the cosmos with a telescope is virtually using a time machine. Astronomers are able to look back at the Universe as it appeared billions of years ago. By comparing the present with the past, they are able to chart its history. We can see how things have changed over the ages and speculate about the origin and future of the vastness of space and all its many wonders.
“Distant, younger, galaxies look very different to nearby galaxies, which means that they’ve changed, or evolved, over time,” said Delhaize. “The challenge is to try and figure out what physical properties within the galaxy have changed, and how and why this has happened.”
According to Delhaize a vital clue to solving the riddle lay in hydrogen gas. By understanding how much of it that galaxies contained will help us map their history.
“Hydrogen is the building block of the Universe, it’s what stars form from and what keeps a galaxy ‘alive’,” said Delhaize.
“Galaxies in the past formed stars at a much faster rate than galaxies now. We think that past galaxies had more hydrogen, and that might be why their star formation rate is higher.”
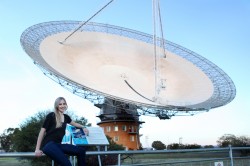
> Jacinta Delhaize with CSIRO’s Parkes Radio Telescope during one of her data collecting trips. Credit: Anita Redfern Photography.
When it comes to distant galaxies, they don’t give up their information easily. Even so, it was a task that Delhaize and her supervisors were determined to observe. The faint radio signals of hydrogen gas were nearly impossible to detect, but the new stacking method allowed the team to collect enough data for her research. By combining the weak signals of thousands of galaxies, Delhaize then “stacked” them to create a stronger, averaged signal.
“What we are trying to achieve with stacking is sort of like detecting a faint whisper in a room full of people shouting,” said Delhaize. “When you combine together thousands of whispers, you get a shout that you can hear above a noisy room, just like combining the radio light from thousands of galaxies to detect them above the background.”
However, it wasn’t a slow process. The researchers engaged CSIRO’s Parkes Radio Telescope for 87 hours and surveyed a large region of galactic landscape. Their work collected signals from hydrogen over a vast amount of space and stretched back over two billion years in time.
“The Parkes telescope views a big section of the sky at once, so it was quick to survey the large field we chose for our study,” said ICRAR Deputy Director and Jacinta’s supervisor, Professor Lister Staveley-Smith.
As Delhaize explains, observing such a massive volume of space means more accurate calculations of the average amount of hydrogen gas present in particular galaxies at a certain distance from Earth. These readings correspond to a given period in the history of the Universe. With this data, simulations can be created to depict the Universe’s evolution and give us a better understanding of how galaxies formed and evolved with time. What’s even more spectacular is that next generation telescopes like the international Square Kilometre Array (SKA) and CSIRO’s Australian SKA Pathfinder (ASKAP) will be able to observe even larger volumes of the Universe with higher resolution.
“That makes them fast, accurate and perfect for studying the distant Universe. We can use the stacking technique to get every last piece of valuable information out of their observations,” said Delhaize. “Bring on ASKAP and the SKA!”.
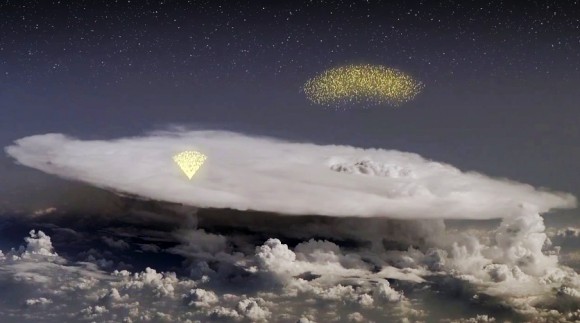
^ Dark lightning occurs within thunderstorms and flings gamma rays and antimatter into space. (Science@NASA video)
Discovered “by accident” by NASA’s Fermi Gamma-ray Space Telescope in 2010, dark lightning is a surprisingly powerful — yet invisible — by-product of thunderstorms in Earth’s atmosphere. Like regular lightning, dark lightning is the result of a natural process of charged particles within storm clouds trying to cancel out opposing charges. Unlike normal lightning, though, dark lightning is invisible to our eyes and doesn’t radiate heat or light — instead, it releases bursts of gamma radiation.
What’s more, these gamma-ray outbursts originate at relatively low altitudes well within the storm clouds themselves. This means that airplane pilots and passengers flying through thunderstorms may be getting exposed to gamma rays from dark lightning, which are energetic enough to pass through the hull of an aircraft… as well as anything or anyone inside it. To find out how such exposure to dark lightning could affect air travelers, the U.S. Naval Research Laboratory (NRL) is conducting computer modeling tests using their SoftWare for the Optimization of Radiation Detectors — SWORD, for short.
Terrestrial Gamma-ray Flashes (TGFs) are extremely intense, sub-millisecond bursts of gamma rays and particle beams of matter and anti-matter. First identified in 1994, they are associated with strong thunderstorms and lightning, although scientists do not fully understand the details of the relationship to lightning. The latest theoretical models of TGFs suggest that the particle accelerator that creates the gamma rays is located deep within the atmosphere, at altitudes between six and ten miles, inside thunderclouds and within reach of civilian and military aircraft.
These models also suggest that the particle beams are intense enough to distort and collapse the electric field within thunderstorms and may, therefore, play an important role in regulating the production of visible lightning. Unlike visible lightning, TGF beams are sufficiently broad — perhaps about half a mile wide at the top of the thunderstorm — that they do not create a hot plasma channel and optical flash; hence the name, “dark lightning.”
A team of NRL Space Science Division researchers, led by Dr. J. Eric Grove of the High Energy Space Environment (HESE) Branch, is studying the radiation environment in the vicinity of thunderstorms and dark lightning flashes. Using the Calorimeter built by NRL on NASA’s Fermi Gamma-ray Space Telescope they are measuring the energy content of dark lightning and, for the first time, using gamma rays to geolocate the flashes.
As a next step, Dr. Chul Gwon of the HESE Branch is using NRL’s SoftWare for the Optimization of Radiation Detectors (SWORD) to create the first-ever simulations of a dark lightning flash striking a Boeing 737. He can calculate the radiation dosage to the passengers and crew from these Monte Carlo simulations. Previous estimates have indicated it could be as high as the equivalent of hundreds of chest X-rays, depending on the intensity of the flash and the distance to the source.
^ Simulation of a Boeing 737 struck by dark lightning. Green tracks show the paths of gamma rays from the dark flash as they enter the aircraft from below. (Credit: U.S. Naval Research Laboratory)
SWORD simulations allow researchers to study in detail the effects of variation in intensity, spectrum, and geometry of the flash. Dr. Grover’s team is now assembling detectors that will be flown on balloons and specialized aircraft into thunderstorms to measure the gamma ray flux in situ. The first balloon flights are scheduled to take place this summer.
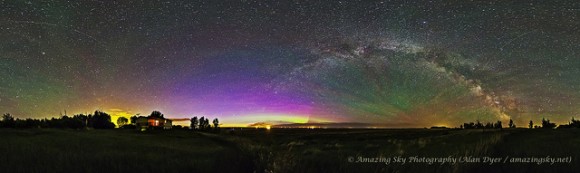
Amazing Astrophoto and Video: Colors of the Sky Universe Today, Nancy Atkinson | June 12, 2013
^ A 360° horizon panorama taken from southern Alberta on June 5, 2013, showing the Milky Way, a low aurora to the north, perpetual twilight glow to the north (left of centre) and bands of green airglow across the sky, and the ATV-4 Albert Einstein heading to the International Space Station. Credit and copyright: Alan Dyer.
Yep, you really want to click on this image to see the larger version on Flickr. Wow — what a view!!
This is a 360° horizon pan, seen by Alan Dyer — who has an aptly named website, The Amazing Sky. This is a view seen from southern Alberta on June 5, 2013, and there is a lot going on in this image. Alan described it on Flickr: “There’s the Milky Way arching across the sky on the right, a low aurora to the north, perpetual twilight glow to the north (left of center) and bands of green airglow across the sky. Left of the house and also left of the main area of Milky Way are horizon glows from urban light pollution. A satellite, the ESA Einstein ATV going to the ISS, is at left of frame.”
I get extremely excited if I can see *one* of those things in a night, and here Alan has captured all at once — superb!
But wait, there’s more!
On June 10, Alan was able to take a timelapse of the Northern Lights and some noctilucent clouds, and it is gorgeous. See below:
Alan said on his website, “This was certainly one of the best NLC displays I’d seen and my best shot at capturing them.”
Find out more about this video here, and Alan shared his technical data on the image: The Panorama was stitched in PTGui software from 8 images taken at 45° spacing with the 8mm lens at f/3.5 on the Canon 5D MkII at ISO 3200. Each is an untracked 1 minute exposure.
You’d think it would be hard to hide a whole exploding star, but the galaxy has managed to do just that for 2500 years.
Supernova remnant G306.3-0.9 somehow managed to elude discovery until 2011, when it was seen during a survey of the galaxy by the orbiting Swift observatory. Swift detects X-rays and gamma-rays, extremely high-energy forms of light emitted by the most powerful and violent events in the Universe—like exploding stars. X-rays from G306 betrayed its existence to Swift, and when astronomers noticed it they swung other telescopes around to investigate.
The image at the top of this postis a combination of observations from the Chandra X-ray Observatory, Spitzer Space Telescope (which sees infrared light), and the Australian Telescope Compact Array (which detects radio waves). X-rays are shown in blue, infrared in red and cyan, and radio in purple.
^ A wide-field view, showing the gas and dust surrounding G306, which is to the lower left. Click to embiggen. Image credit: X-ray: NASA/CXC/Univ. of Michigan/M. Reynolds et al; Infrared: NASA/JPL-Caltech; Radio: CSIRO/ATNF/ATCA
The circular shape of the object is a big hint to its origin as an exploding star, but the presence of X-rays is the clincher. When a star explodes, it blasts out a brain-crushing amount of matter and energy. The expanding debris can outmass the Sun by a factor of ten or more, screaming outwards at a substantial fraction of the speed of light. The energy emitted in a supernova in just a few weeks is the equivalent of the Sun’s output over its entire lifetime of 10 billion years.
The violence of a supernova is almost too much to comprehend.
This is belied by the beauty and apparent serenity of the image, isn’t it? We see it frozen in time, its vast power diminished by distance. It’s only through our understanding of physics and mathematics that we can even begin to understand the forces at work here.
< Swift detected gamma rays from the supernova remnant; each dot is a single gamma ray. The shape of G306 is obvious. Image credit: NASA/Swift/Stefan Immler
The star exploded about 2500 years ago (ignoring the time it took for the light to reach us) and the debris has expanded to about 25 light years in diameter. That means the material was blasted outwards to at least 1% the speed of light—and probably more, given it slows down over time as it rams through the thin material between the stars. As it slams into that gas, shock waves form in a similar way that sonic booms are created from supersonic aircraft. These shocks bounce around in the material, compressing it, and playing havoc with the magnetic fields inside. This accelerates subatomic particles to fantastic speeds, just under that of light itself, and it’s the interaction of the particles with those magnetic fields that generates the X-rays seen by Chandra and Swift.
Stars explode in our galaxy every century or so on average. We know of roughly 300 supernova remnants in our own galaxy, and G306 is one of the youngest. Some are tens of thousands of years old, and a handful older yet. Many of them are when a massive star explodes after a very short life, so they are still embedded in the gas and dust clouds from which they were born. That absorbs the fierce light, obscuring them from our view. That in turn means there are probably hundreds more supernova remnants in the Milky Way, many as young or younger than G306, which remain undiscovered.
It’s incredible that one of the singular violent events possible in the Universe can be relatively nearby yet be completely invisible. But we’re getting better at this. Our telescopes improve all the time, and we keep a sharp eye on the sky. I expect that over time, many more of these hidden cataclysms will come to light.
Art will be the last bastion when all else fades away. ~ Timothy White (b 1952), American rock music journalist _________________
^ Popocatépetl had a bit of a bad day on June 17, 2013. Photo by webcamsdemexico, from the video
I don’t think most people are aware that Mexico has a lot of volcanoes, and some are quite active. Popocatépetl is located just 70 kilometers (40 miles) from Mexico City, and it’s been rumbling and grumbling since 1991. Because of this, the volcano is constantly monitored, and because of that, we get to see this awesome time-lapse video, taken on June 17, just after 13:00 local time, of Popocatépetl blowing its top:
Wow! You can actually see the shock wave blowing away from the vent and the blast moving down the flank of the volcano and disturbing the material there. A few seconds later you can see boulders and other dislodged matter rolling (or more likely shot) down the flank. (The motion is accelerated in the time-lapse; the entire video covers about 12 minutes of real time.)
The ash cloud rose to a height of several kilometers and dissipated as it blew downwind to the southwest (away from Mexico City, happily). Volcanic material was blown out for a few kilometers around the area, setting small fires in the grass, but no one has been reported as injured. Roads around the summit have been closed, and traffic within 12 kilometers (8 miles) has been restricted. Sounds like a good idea to me.
In a few days I’ll be in Oregon for Science Getaways, traipsing among the volcanoes there. None is likely to show any grand activity while we’re there, but we’ll be investigating lava tubes, obsidian fields, and canoeing in a caldera lake. I expect to be tweeting a lot of pictures. Stay tuned!
^ The spectacularness of Saturn, with Earth hanging in the distance. This mosiac was taken by the Cassini spacecraft in 2006. Click to encronosenate. Photo by NASA/JPL/Space Science Institute
If you’ve ever wanted your picture taken from more than 1 billion kilometers away, here’s your chance. On July 19 between 21:27 to 21:42 UTC (5:27–5:42 p.m. EDT), the Cassini spacecraft will be pointed toward Earth for a series of what will no doubt become iconic pictures of Saturn and our home world together.
The images are being taken as part of a giant mosaic of Saturn that will be captured by Cassini. The spacecraft orbits Saturn and over the course of four hours will be in a part of its orbit where the disk of the planet itself will block the Sun. Cassini will see the rings backlit, the planet dark, with perhaps a halo of light circling the disk due to sunlight scattered by its atmosphere.
^ Illustration of Cassini’s view of Saturn during the planned observations. Illustration by NASA/JPL-Caltech
But just off to the side, a bit below Saturn’s face, will hang the pale blue dot of Earth, 1.45 billion kilometers (900 million miles) away. Even from that terrible distance, Cassini’s cameras should be able to detect the Earth’s Moon as well.
< Cassini’s view of Earth during the planned observations. In reality, the entire planet will be about 2 pixels across. Click to gaianate. Illustration by NASA/JPL-Caltech
During the 15-minute window outlined above, the spacecraft will have its cameras pointed at Earth, taking images in a series of filters to provide a relatively true-color image. The United States will be in sunlight then, but it will be night for people in Europe. The illustration here shows what part of the Earth will be seen by Cassini from Saturn; if you see your part of the world, then Cassini will see you. Be sure to go outside and wave. (Note: The folks at Cassini have already accounted for the 80 minutes it takes light to go from Earth to Saturn, so the times above are the times to wave.)
Now, to be clear, the entire face of our planet will be at best 2 pixels in size from Cassini, and the Earth is roughly 100 million times wider than your face. You’ll be, um, unlikely to recognize yourself. But when the final picture is put together, you’ll have the knowledge that when Cassini was looking at you, you were looking right back.
The final image should be spectacular. The picture at the top of this post was taken in 2006 and shows what it looks like when the Saturnian system is backlit by our star. Earth is in that shot (indicated by the arrow), a tiny blue bit just outside the bright main rings. (A similar shot was taken in 2012, sans Earth.) It made quite a splash (I picked it as my top picture of 2006, which proved so popular it jammed the Cassini Web servers at the time), and for good reason. It’s gorgeous, it’s weird, and it gives us a sense of just how remote and lonely and wonderful and audacious our exploits can be.
Cassini is a plutonium-powered school-bus-sized robot that’s been orbiting Saturn for nearly a decade, and we put it there. That’s reason enough to take a moment and celebrate what we can do. And if you don’t believe me, read what Cassini Imaging Team Leader Carolyn Porco has to say about this. It’s inspiring.
The science Cassini does is astonishing, and we’ve learned more about Saturn in the past decade due to it than we had in the previous century. Scientists will be studying that data for the next century to come … but even so, it’s not all about science. Sometime it’s OK to stand back, admire the art, and realize that it can be about us.
Art will be the last bastion when all else fades away. ~ Timothy White (b 1952), American rock music journalist _________________
^ Radar images of asteroid 1998 QE2 and its satellite on June 7. Each frame in the animation is a sum of 4 images, spaced apart by about 10 minutes. (Arecibo Observatory/NAIC/Sean Marshall)
On the last day of May 2013 asteroid 1998 QE2 passed relatively closely by our planet, coming within 6 million kilometers… about 15 times the distance to the Moon. While there was never any chance of an impact by the 3 km-wide asteroid and its surprise 750 meter satellite, astronomers didn’t miss out on the chance to observe the visiting duo as they soared past as it was a prime opportunity to learn more about two unfamiliar members of the Solar System.
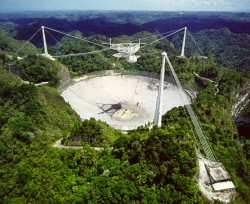
By bouncing radar waves off 1998 QE2 from the giant dish at the Arecibo Observatory in Puerto Rico, researchers were able to construct visible images of the asteroid and its ocean-liner-sized moon, as well as obtain spectrum data from NASA’s infrared telescope in Hawaii. What they discovered was quite surprising: QE2 is nothing like any asteroid ever seen near Earth.
< The 305-meter dish at Arecibo Observatory in Puerto Rico (Image courtesy of the NAIC – Arecibo Observatory, a facility of the NSF)
Both Arecibo Observatory and NASA’s Goldstone Deep Space Communications Complex in California are unique among telescopes on Earth for their ability to resolve features on asteroids when optical telescopes on the ground merely see them as simple points of light. Sensitive radio receivers collect radio signals reflected from the asteroids, and computers turn the radio echoes into images that show features such as craters and, in 1998 QE2’s case, a small orbiting moon.
QE2’s moon appears brighter than the asteroid as it is rotating more slowly; thus its Doppler echoes compress along the Doppler axis of the image and appear stronger.
Of the asteroids that come close to Earth approximately one out of six have moons. Dr. Patrick Taylor, a USRA research astronomer at Arecibo, remarked that “QE2’s moon is roughly one-quarter the size of the main asteroid,” which itself is a lumpy, battered world.
Dr. Taylor also noted that our own Moon is a quarter the size of Earth.