alloneword » Sat Mar 28, 2020 4:24 pm wrote:alloneword » Sat Mar 28, 2020 3:34 pm wrote:The study: https://www.medrxiv.org/content/10.1101 ... 20042291v1
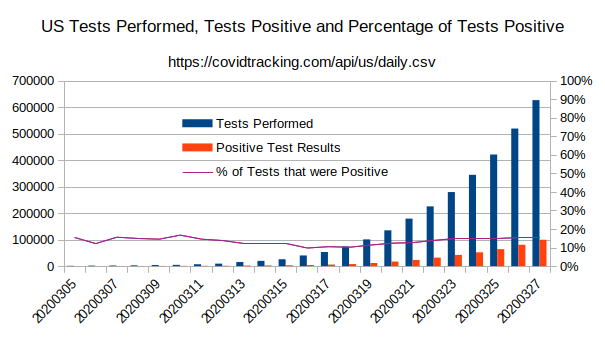
This makes more sense of the pattern in the data that shows the percentage of tests performed that yield a positive result appears fairly static (~15% - certainly true in the US and UK).
UK similar at ~14%, apparently Germany 6 - 7% (machine translation).
Does anyone know the criteria for testing in the US? In the UK, it's 'requiring admission to hospital' plus symptoms (those not deemed in need of hospital treatment are 'not prioritised'). Reports of shortages of testing kits would seem to indicate that only those in the higher priority groups are being tested.
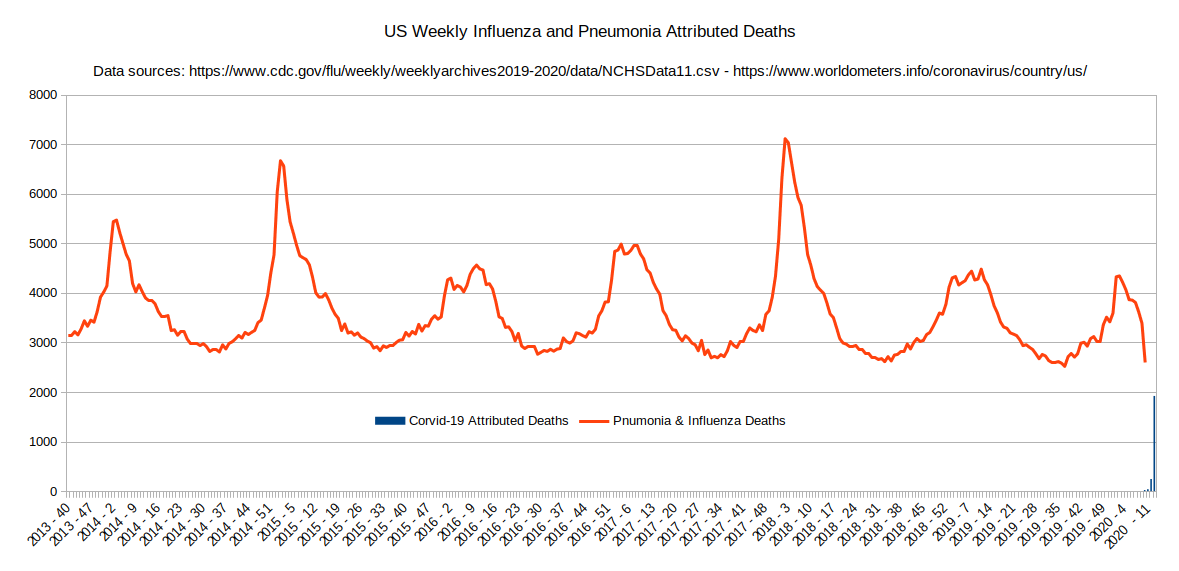
So, does this mean that around 120,766 people have been admitted to hospital displaying ILI symptoms (since we started testing for covid-19) of which 103,687 (~86%) tested 'negative'? Quite how many - or what percentage - of those non-corvid ILI sufferers succumbed to the 'old man's friend' we don't yet know. But previous years offer a clue.
But that number looks outrageously high to me.
Historic figures on the number of people admitted to hospital (inc non-ICU/HDU) for ILIs isn't readily available (as not all data is collected, it would seem), but we can get an idea from the 'Rate of Admissions per 100,000 in the Trust catchment area' - which looks to have peaked at around '10' (0.01%) in early 2018. Crudely extrapolate that out for a population of 66 million and we get 6600 hospital admissions for Influenza per week (this would be the peak of a bad year, 26,400 deaths).
If we take this 'crisis' to have started in the UK on 1st Feb (first case reported on Jan 31st) - a mere 8 weeks ago - and crudely divide that number of non-corvid ILI hospitalised people (103,687) we get a figure just shy of 13,000 per week (every week, for 8 weeks).
Can anyone point out where I've gone wrong, or does it look like there are an insanely high number of non-Covid19 ILI cases occurring?

Good points raised here.
I've read somewhere - and will need to dig further to corroborate - that the testing being performed is not for CoVID-19 specifically, but for any Coronavirus, which would of course cause the 'infected' numbers to balloon considerably relative to CoVID-19 cases specifically.
Re: death counts: has a chart been generated comparing death count totals -- across all causes -- in 2019 for a given city (such as London or NYC) to death count totals in 2020 for the same time period?
To what extent are we dealing with flawed data, or data manipulated to support narratives that may not reflect actual circumstances? (Malleable nature of statistics rearing its ugly head again).