Arctic Updates

Moderators: Elvis, DrVolin, Jeff

Postby Penguin » Mon Nov 10, 2008 1:59 am

Ok, here it is, WHOIS information, IPs, and location of the servers of "International Climate Science Coalition".

Main server (address http://www.climatescienceinternational.org/, IP 68.178.254.234 )

Whois data:
OrgName: GoDaddy.com, Inc.
OrgID: GODAD
Address: 14455 N Hayden Road
Address: Suite 226
City: Scottsdale
StateProv: AZ
PostalCode: 85260
Country: US

NetRange: 68.178.128.0 - 68.178.255.255
CIDR: 68.178.128.0/17
NetName: GO-DADDY-SOFTWARE-INC
NetHandle: NET-68-178-128-0-1
Parent: NET-68-0-0-0-0
NetType: Direct Allocation
NameServer: CNS1.SECURESERVER.NET
NameServer: CNS2.SECURESERVER.NET
NameServer: CNS3.SECURESERVER.NET
Comment:
RegDate: 2005-04-12
Updated: 2007-06-14

OrgAbuseHandle: ABUSE51-ARIN
OrgAbuseName: Abuse Department
OrgAbusePhone: +1-480-624-2505
OrgAbuseEmail: abuse@godaddy.com

OrgNOCHandle: NOC124-ARIN
OrgNOCName: Network Operations Center
OrgNOCPhone: +1-480-505-8809
OrgNOCEmail: noc@godaddy.com

OrgTechHandle: NOC124-ARIN
OrgTechName: Network Operations Center
OrgTechPhone: +1-480-505-8809
OrgTechEmail: noc@godaddy.com

# ARIN WHOIS database, last updated 2008-11-09 19:10
# Enter ? for additional hints on searching ARIN's WHOIS database.


"New Zealand" site :)
http://www.nzclimatescience.org/ IP 68.178.254.234 - O hai, its the same IP! Haha...Yeah. Its not in New Zealand at all, but on the same physical server as the main site. This does not make any sense - overseas data transfers are slower and more expensive for the ISPs. Especially New Zealand or Australia that are way out there - if the sites are supposedly serving local needs, why are they all in USA? This is suspect.

"Australian" site ...
http://www.auscsc.org.au/ (Notice the country ending .au!), emm, IP (hold your breath): 68.178.254.234 ! O HAI! The "Australian" server too, is the same server.

Lets see the traceroute (ie. what route the packets take from me here in the Arctic to them in the US)

Goes, as expected, thru the Big Brother data scanners in Sweden first (Thanks, FRA!), then hops to Global Crossing network at IP 64.210.13.110
OrgName: Global Crossing
OrgID: GBLX
Address: 14605 South 50th Street
City: Phoenix
StateProv: AZ
PostalCode: 85044-6471
Country: US

And then the final hop to 2 of their hosts own servers:
208.109.112.198 , 216.69.188.45
OrgName: GoDaddy.com, Inc.
OrgID: GODAD
Address: 14455 N Hayden Road
Address: Suite 226
City: Scottsdale
StateProv: AZ
PostalCode: 85260
Country: US

NetRange: 208.109.0.0 - 208.109.255.255
CIDR: 208.109.0.0/16
NetName: GO-DADDY-SOFTWARE-INC
NetHandle: NET-208-109-0-0-1
Parent: NET-208-0-0-0-0
NetType: Direct Allocation
NameServer: CNS1.SECURESERVER.NET
NameServer: CNS2.SECURESERVER.NET
NameServer: CNS3.SECURESERVER.NET


Notice also the lack of any real contact information directly to the sites crew. There is only the contact info of GoDaddy!
This is also very suspect. Normally only spammers, virus and worm writers and other miscreants and cheats do this. A regular law abiding institution would have its info up in the WHOIS.


A cardboard cutup and paste bullshit PR operation for Big Business.

Edit: removed my horrid caps :)

"
* Misspelled domains are big deceivers. Phishers will purchase a domain name that resembles the real domain. They will replace letters with numbers or with other letters. Pay close attention to the spelling of a domain names, and learn to spot a fake like www.yohoo.com or http://www.paypol.com/.
* Variations of domains should also be a red flag. Don’t click on any email that contains URLs like http://center.yahoo-security.net. A legitimate URL should read http://center.yahoo.com if it actually belongs to Yahoo! Anyone could’ve purchased www.yahoo-security.net for a scam (I’m just using Yahoo! as an example here).
* An IP address looks something like 102.199.60.250. Bottom line, never trust emails that point you to URLs that only show an IP address.
"
http://www.technospot.net/blogs/how-to- ... -phishing/

This is the very same thing. How am I supposed to trust them when they lie to every visitor on their site about these basic things - who they are, and where they are located? And remain faceless and anonymous (no, Im not anonymous - my IP isnt masked in any way, and I dont claim to be in Iceland, South Pole and Canada, running the worlds leading climate sceptic foundation. I know we have a climate - Im breathing it)

Again I reiterate - I have no faith, trust or any of the sort in these Green Fascist types who dream of their sordid solutions to problems they caused in the first place and refused to even try to remedy in time. But that doesnt mean the issue isnt real. The solution isnt carbon taxes and 24/7 surveillance of people and forced sterilizations thou. Thats just what theyd like to sell you alongside. But they are similar businessmen as the seeming PR people running this "climate site".
Last edited by Penguin on Mon Nov 10, 2008 4:23 pm, edited 1 time in total.
Penguin
 
Posts: 5089
Joined: Thu Aug 23, 2007 5:56 pm
Blog: View Blog (0)

Postby Ben D » Mon Nov 10, 2008 8:01 am

wintler2 wrote:More phytoplankton is crudely speaking a good thing i believe, should take more CO2 out of atmosphere.


Just brilliant winkler, monster's increased carbon footprint is going to be be neutralized by
the increase in phytoplankton/municellular algae.

You really should not worry so much, nature is just so awesome!
User avatar
Ben D
 
Posts: 2005
Joined: Sun Aug 12, 2007 8:10 pm
Location: Australia
Blog: View Blog (3)

Postby wintler2 » Mon Nov 10, 2008 9:42 am

Penguin wrote:Ok, here it is, WHOIS information, IPs, and location of the servers of "International Climate Science Coalition".
..
NOTICE also the lack of ANY contact information directly to the sites crew. There is ONLY the contact info of GoDaddy!
This is also VERY suspect. Normally only spammers, virus and worm writers and other miscreants and cheats do this. A regular law abiding institution WOULD have its info up in the WHOIS.

A cardboard cutup and paste bullshit PR operation for Big Business.


Thanks for the legwork Penguin.

It looks like yet another no-contest from our resident propolluter spammers, this time regarding the ICSC being a mere virtual PR front. Great, and ho hum at the same time.

If they were human surely they'd be embarrassed about misleading everybody, but then some people never develop any sense of responsibility.
"Wintler2, you are a disgusting example of a human being, the worst kind in existence on God's Earth. This is not just my personal judgement.." BenD

Research question: are all god botherers authoritarians?
User avatar
wintler2
 
Posts: 2884
Joined: Sun Nov 12, 2006 3:43 am
Location: Inland SE Aus.
Blog: View Blog (0)

Postby tazmic » Mon Nov 10, 2008 1:35 pm

A regular law abiding institution WOULD have its info up in the WHOIS.


Wintler2, you might think this is off topic, but as this topic does seem to
largely involve your consistently unpleasant, personalized spew against
anyone presenting links for RI's consideration of which you disapprove,
I am wondering if you are the sort of person who would say

'A regular law abiding person WOULD have its info up in the [database]'

In the sense of 'The innocent have nothing to fear'.

Just curious. (It would explain a lot.)
User avatar
tazmic
 
Posts: 1097
Joined: Mon Mar 19, 2007 5:58 pm
Blog: View Blog (0)

Postby Penguin » Mon Nov 10, 2008 4:11 pm

I said that.
Usually people besides spammers and fakes do have some legit contact info there.

On the other hand, fake sites and sites that spread malware, and sites that are someone else than they claim to be usually dont, and instead have just some generic contact info to their hosting / domain provider company, in this case, the ubiquitous GoDaddy. That way, you are truly pretty anonymous, and can claim to be Jesus Buddha of the Winds, or a society of Concerned Scientists. Or a website referencing itself actually while claiming (poorly) to be 3 websites in 3 different countries. Usually a Whois lookup is the first step in verifying if a website is really who they claim to be. Everyone needs to have some information there or they wont get a domain name. This is also the reason why so often the addresses of "Al Qaeda websites" arent mentioned - anyone could look them up. The one time I did see the address mentioned, it was in Texas physically. Cooo...

Ok, my formatting there is hideous. Sorry bout that, I was on coffee.

:D -> http://www.crime-research.org/news/16.03.2007/2565/
By means of such resources criminals misappropriate money transferred to accounts of aid funds. It is often easy to recognize a fake charity fund by absence of exact information about organizers: there are no names, establishment or registration numbers.
Penguin
 
Posts: 5089
Joined: Thu Aug 23, 2007 5:56 pm
Blog: View Blog (0)

Postby Cosmic Cowbell » Mon Nov 10, 2008 5:12 pm

I wish to thank those who have contributed here, on both sides of this issue. It is a microcosm of the larger debate - one that basically ended a few years back but none the less still continues in the far flung regions of the vast network of pipes we call virtual home.

It's interesting when you step back and take a look at the arguments and documentation put forth by the active participants here. On the one hand, those who believe that anthropogenic global warming is a reality (myself included) and a fairly dangerous long term one at that tend to present scholarly articles or other news articles that reference them. Most are from well respected institutions or academics and tend to have particular data points or research backing them up. They are often peer reviewed as a prerequisite to publication and for the most part, are accepted as sound science.

On the other hand are those who seem to dismiss the evidence for Mans fingerprint on the global warming issue. They tend to offer articles that use questionable research or quote the outright misinformed (see Monsters reference to a news article a few pages back and his lack of admission to it's falsity). They also favor as a resource, blogs tending to be skeptical of AGW that are often written by laymen or those who offer ill informed opinion such as Anthony Watts, TV Weatherman (whose blog has been oft quoted here) or Bjorn Lomborg, Economist (read PR shill for Big Business). And when acknowledged scientist are used, 50% of the time their funding can be traced back to Exxon or some other front organization used by Big Oil. The latest in the denialist arsenal appears to be the use of sock puppet websites of unknown origins.

Does anybody see a pattern here?

If you don't, just keep watching. It really has absolutely no choice to but to become self evident in the long run. I will continue to post articles by what most consider respected scientist or institutions (as will others I hope) while the denialist will continue to ignore the research and attempt to distract by baiting those who stand in opposition to weak or non-existent arguments. You can witness it starting just above, whether it be calling Wintler "Winkler" as Ben D has taken to doing or Monsters lame attempt at distraction by his threats of starting a fire in his fireplace :roll:. What you won't (and will never) see here is a well presented, cohesive argument against the evidence for AGW. You can't see what truly doesn't exist.

This is what happens when one cannot sustain an argument, or is collapsed under the weight of a weak one. I predict you will either see them continue to post nonsense (as has been happening) or they will frequent this thread less often, if at all. Do not expect them however to "Man Up" and admit they might have been a little too firm in their opinion. That said, I continue to welcome their presence in this thread as it has elevated it to more than just another back and forth on AGW.

This really is a classic, and again, I thank all who have willingly (or unwillingly) educated us.

BTW-

NASA says ozone layer hole 5th biggest on record

Last Updated: Wednesday, November 5, 2008 | 2:41 PM ET
CBC News

The hole in the ozone layer over Antarctica this year is the fifth biggest on record, according to the latest data from NASA's atmospheric scientists.

NASA said on Sept. 12, 2008, the ozone hole reached its annual maximum area of 27.2 million square kilometres, up from last year's 25.1 million square km. By comparison, the total land area of North America is about 24.7 million square km.

The hole is considered "moderately large," said NASA atmospheric scientist Paul Newman. The largest ozone hole ever recorded occurred in 2006, at a size of about 27.4 million square kilometres.

Ozone, a bluish gas composed of three oxygen atoms, is harmful to breathe, but absorbs ultraviolet radiation that harms living organisms. Its presence in our stratosphere helps keep harmful UV rays originating from the sun from reaching the Earth. The hole typically reaches its maximum extent in September or early October, and then dissipates into smaller parts throughout southern latitudes, affecting the UV exposure in places such as New Zealand, Australia and South America, NASA said.

NASA has been monitoring the depletion of ozone above Antarctica through satellite observations since the 1970s. The increasing size of the hole in the 1980s was the motivation behind restrictions on the use of chlorofluorocarbons, or CFCs. Newman said that while the ozone hole is large, the amount of human-produced substances that contribute to its depletion has actually decreased about 3.8 per cent from peak levels set in 2000. In addition to CFCs, the potential harmful substances include hydrochlorofluorocarbons, which have been used as a refrigerant in air conditioners and fridges, and halons, which act as a propellant for fire extinguishers.

link
User avatar
Cosmic Cowbell
 
Posts: 1774
Joined: Sun Jan 22, 2006 5:20 pm
Blog: View Blog (0)

Postby wintler2 » Mon Nov 10, 2008 10:26 pm

Cosmic Cowbell wrote:..
Does anybody see a pattern here?

If you don't, just keep watching. It really has absolutely no choice to but to become self evident in the long run. I will continue to post articles by what most consider respected scientist or institutions (as will others I hope) while the denialist will continue to ignore the research and attempt to distract by baiting those who stand in opposition to weak or non-existent arguments. You can witness it starting just above, whether it be calling Wintler "Winkler" as Ben D has taken to doing or Monsters lame attempt at distraction by his threats of starting a fire in his fireplace :roll:. What you won't (and will never) see here is a well presented, cohesive argument against the evidence for AGW. You can't see what truly doesn't exist.

This is what happens when one cannot sustain an argument, or is collapsed under the weight of a weak one. I predict you will either see them continue to post nonsense (as has been happening) or they will frequent this thread less often, if at all. Do not expect them however to "Man Up" and admit they might have been a little too firm in their opinion. That said, I continue to welcome their presence in this thread as it has elevated it to more than just another back and forth on AGW. ..

Nicely put CC, only thing i'll add is 'skeptics' also love to personalise the argument, to which i reactively retaliate (my bad). But there sure is a pattern, one of persistant systematic disinformation being continually copynpasted (not discussed, defended, explored) and put before our eyes.

The sponsors of such content know exactly what they are doing, and i am grimly aware of how effective their repetition is so i feel must continue to fight it by naming and shaming. I do retaliate across the personalising line too often, but i desperately hope no-one is distracted from the facts or rather best data and its significance.
"Wintler2, you are a disgusting example of a human being, the worst kind in existence on God's Earth. This is not just my personal judgement.." BenD

Research question: are all god botherers authoritarians?
User avatar
wintler2
 
Posts: 2884
Joined: Sun Nov 12, 2006 3:43 am
Location: Inland SE Aus.
Blog: View Blog (0)

Postby Penguin » Tue Nov 11, 2008 3:14 am

http://greenfyre.wordpress.com/2008/11/ ... ets-fried/

"The climate change / global warming Denier1 “Global Cooling” myth just get’s more and more obviously ridiculous every day.

Just a week ago I blogged about the recent Denier spam fest about media reports of local cold snaps. Several of the points I made then have gotten more empirical support since, so this is a quick update.

Surprise - it is still true that regional weather tells you nothing of about climate. Now that the Microwave Temperature Images for October have been released we can see just how true that is. The October 2008 continental U.S. anomaly was -0.135 K ie slightly below normal, while the Northern Hemisphere anomaly was +0.283 K, ie above normal. Globally the (land/sea) anomaly: +0.181 Kelvin ie warmer than normal.

The data also emphasizes how completely useless popular media stories about weather are for giving one any sense of even global weather, much less climate. Looking at the global temperature anomaly map below (red is warmer than normal, blue colder) we can see just how the world looked in Oct.
Image
Reds are warm anomalies, while the darker blues are cold anomalies.

Is anyone really surprised that we got bombarded with stories about cold snaps in the US and Britain, regions saturated with media, while the heat in Africa, Australia, Northern Canada and Northern Russia was largely ignored? (where’s my Homer Simpson emoticon?).

If distant and unfamiliar countries get under-reported, how much more so the open ocean? The NOAA has a sea surface temperature animation here (for keeners), but let’s look at their September 2008 Temperature Anomaly maps from the National Climatic Data Center (Oct not available yet).
Septembers Land Surface Temperature Anomalies in degrees Celsius

Image

From the Land Surface map we see overall September was clearly warmer than normal, but not particularly so. Now if we look at the Blended Land and Sea Surface Temperature Anomalies.!

Image

Look’s a bit different, doesn’t it? In fact September 2008 was the 9th warmest ever since 1880.

But let’s not fall into the same trap that the Deniers do. So far all I have demonstrated is that Denier spam is hopelessly wrong about the weather, what about the climate? The fact is that 2008 could be a record cold year globally instead of the 9th warmest (to date) in 129 years and it still would not matter.

I will repeat it as often as necessary, for climate it is the long term trend that matters. Decades, not years, and definitely not one week in the US. So what is the long term trend? Definitely NOT the photoshopped trends that frauds like Gunter and Keen use. The real one looks like these (depending on method of trend analysis).

Image

Image

So, it’s getting warmer. A bit warmer? Getting back to all those Denier spam stories about no warming in a decade, we learn today that “Warming Trend Is Steepest in 5,000 Years” “Research on Arctic and North Atlantic ecosystems shows the recent warming trend counts as the most dramatic climate change since the onset of human civilization 5,000 years ago … .

Let’s emphasize that: “the most dramatic climate change since the onset of human civilization 5,000 years ago“

Does reality slow down the Deniers? Not one bit.

Michael Asher tired to spin the expanding sea ice meme in September in a posting so bad that Deltoid debunked it under the title “You can’t make this stuff up.” Barely two months later we learn from Asher that “Sea Ice Growing at Fastest Pace on Record.”

Some dramatic new development that the rest of us missed? Hardly. It is the same meme as last time. In the interest of “fairness and balance” (I suppose) he is dismissive of researcher Bill Chapman who is actually studying it and says “no big deal.”

To counter Chapman he offers us Patrick Michaels, proponent of the “Climate Change stopped in 1998” fraud and who is doing no related research whatsoever. Michaels uses some carefully chosen language to use the sea ice extent to try and imply that the southern hemisphere isn’t warming (false) and that we expect the Southern Hemisphere to warm as fast as the Northern (false). Asher than states that Antarctica is in a long term cooling trend, failing to mention that it is currently warming.

burning-snowSigh

Of course no one knows what 2009 will be like, but I will risk one prediction.

Despite all of the above we will continue to see the “Global Cooling” fraud over and over and over in the Denialosphere.

Antarctica could burst into flame and they would claim it was cooling. I can see the Asher article now: “Rapid expansion of ice sheet triggers spontaneous combustion.”

Reality has never had the slightest influence on what they claim in the past, why would it now?"


Lots and lots of links at the storys original location. Check em out if you like.
Penguin
 
Posts: 5089
Joined: Thu Aug 23, 2007 5:56 pm
Blog: View Blog (0)

Postby Ben D » Tue Nov 11, 2008 6:01 am

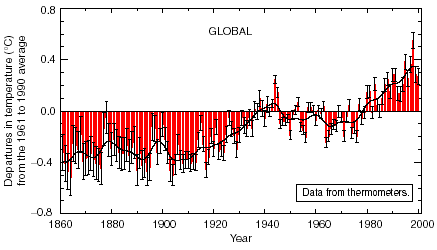
According to this IPCC report, it shows that the global average surface temperature has increased over the 20th century by about 0.6°C.
Now the temperature swings year by the year, and by the decade throughout the century were sometimes many times greater then that figure, yet at the end of the century and the averaging calculations are done,...a mere 0.6 degree C increase is seen over 100 years.

Now how alarming is a 0.6 degree C increase over 100 years?

We are now just 9 years into the 21st century and the variability of year on year temperature swings continue, but the actual average
increase or decrease for the century will not be known for another 91 years.

Sure, the IPCC have projected an average increase of between around 1.2% to 3.8 % between the end of the 20 th century to the year 2100, but that is still a theoretical projection at this stage and given the nature of planet earth's climate variability, no one will really know until all the numbers are in.

So all, please be patient and don't get too excited about year on year changes or even a few decades.

The global average surface temperature has increased over the 20th century by about 0.6°C.

The global average surface temperature (the average of near surface air temperature over land, and sea surface temperature) has increased since 1861. Over the 20th century the increase has been 0.6 ± 0.2°C5, 6 (Figure 1a). This value is about 0.15°C larger than that estimated by the SAR for the period up to 1994, owing to the relatively high temperatures of the additional years (1995 to 2000) and improved methods of processing the data. These numbers take into account various adjustments, including urban heat island effects. The record shows a great deal of variability; for example, most of the warming occurred during the 20th century, during two periods, 1910 to 1945 and 1976 to 2000.


Link
Last edited by Ben D on Tue Nov 11, 2008 6:07 am, edited 1 time in total.
User avatar
Ben D
 
Posts: 2005
Joined: Sun Aug 12, 2007 8:10 pm
Location: Australia
Blog: View Blog (3)

Postby Penguin » Tue Nov 11, 2008 6:07 am

Yeah, lets not do anything until we are certain that we fucked it all up. Before we hit the wall its too soon to say, and it would be chickening to hit the brakes. Theres no wall there, trust me. You could interpret that data any number of ways!

I see the changes daily here up north where I live. Ecosystems that have existed for 9000 years, ever since the last ice age here, have started to change and vanish. Our closest sea is changing into poisonous green goo more and more every year due to nutrients leaching from neighbouring countries and feeding poisonous algae growth that kills other life. The water is not fit to even swim in. Palsa mires in Lapland are vanishing - they are frozen peat cores that have been constantly frozen for thousands of years - never melting during the brief and cool northern summer. Now theyre going too.

I believe my eyes, if something. I see human wrought destruction everywhere, and yet I live in a relatively sparsely populated country.
Penguin
 
Posts: 5089
Joined: Thu Aug 23, 2007 5:56 pm
Blog: View Blog (0)

Postby Ben D » Tue Nov 11, 2008 6:20 am

Penguin wrote: You could interpret that data any number of ways!

I believe my eyes, if something. I see human wrought destructionverywhere, and yet I live in a relatively sparsely populated country.


I am not interpreting the data, this is the assessment from the United Nations Intergovernmental Panel on Climate Change (IPCC)

With due respect, you were not even in existence when half of the data for this study had already been collected, so try and be a little scientific and remove the subjective emotional factor from the analysis.
User avatar
Ben D
 
Posts: 2005
Joined: Sun Aug 12, 2007 8:10 pm
Location: Australia
Blog: View Blog (3)

Postby wintler2 » Wed Nov 12, 2008 3:50 am

Ben D wrote:According to this IPCC report, it shows that the global average surface temperature has increased over the 20th century by about 0.6°C.
A reference, and not from Exxon, i should buy you a beer for proving me wrong! Instead i'll just provide a page link where can get IPCCs more recent 4th assessment report http://www.ipcc.ch/ipccreports/assessments-reports.htm

Ben D wrote:Now the temperature swings year by the year, and by the decade throughout the century were sometimes many times greater then that figure, yet at the end of the century and the averaging calculations are done,...a mere 0.6 degree C increase is seen over 100 years.
You are confusing variation between years with trend over time - the trend is no less significant if measured warming trend over decades is less than warm/cool variation between years. e.g. I might have more or less for dinner, does that mean it doesn't matter if i get fatter? No, the trend is all, the intra/inter-annual variation much less important.

Ben D wrote:Now how alarming is a 0.6 degree C increase over 100 years?
Given its a global land+sea average, given we're already seeing major impacts and emissions are still rising, very.
Image

Ben D wrote:We are now just 9 years into the 21st century and the variability of year on year temperature swings continue, but the actual average increase or decrease for the century will not be known for another 91 years.
Eh? you think the ice wont melt until we measure it? you must be an economist lol

Ben D wrote:Sure, the IPCC have projected an average increase of between around 1.2% to 3.8 % between the end of the 20 th century to the year 2100, but that is still a theoretical projection at this stage and given the nature of planet earth's climate variability, no one will really know until all the numbers are in.
% of what? The projections are by definition theoretical, the measured warming & melting are however observations.

Ben D wrote:So all, please be patient and don't get too excited about year on year changes or even a few decades.
Based on your red herrings? i don't think so.
"Wintler2, you are a disgusting example of a human being, the worst kind in existence on God's Earth. This is not just my personal judgement.." BenD

Research question: are all god botherers authoritarians?
User avatar
wintler2
 
Posts: 2884
Joined: Sun Nov 12, 2006 3:43 am
Location: Inland SE Aus.
Blog: View Blog (0)

Postby Ben D » Wed Nov 12, 2008 6:17 am

Here is a graph covering 140 years from 1860 to 2000.

Image

SOURCE: "Summary for Policymakers"—A Report of Working Group I of the Intergovernmental Panel on Climate Change, 2001

An extended graph that includes the next 100 years is yet in the future.

Due to the present imperfect understanding of solar/planetary science, no one can say with total confidence what it will look like.
User avatar
Ben D
 
Posts: 2005
Joined: Sun Aug 12, 2007 8:10 pm
Location: Australia
Blog: View Blog (3)

Postby Penguin » Wed Nov 12, 2008 6:23 am

Yeah. I dont know if the sun will rise tomorrow or not. Its still several hours in the future. We wont see until next morning, will we?
Penguin
 
Posts: 5089
Joined: Thu Aug 23, 2007 5:56 pm
Blog: View Blog (0)

Postby Penguin » Wed Nov 12, 2008 7:37 am

I dont know why you always refer to just data from like last 100 years. We have very accurate data of both temperatures and air gases for a few thousands of years, from very old trees - drilled samples from them tell very exactly what the climate conditions were when the respective year rings originally grew.

Then we have ice core samples, also spanning thousands of years. Ice kilometers thick has trapped air inside, and that can be analyzed and tells exactly what air was like at that time. We can compare this data with tree data and geological sea bottom and soil sampling. They can all be cross-correlated for added accuracy.

Then, for the last couple hundred years, we have observations. Even in the middle ages (and before that elsewhere) people were writing down the weather. Sometimes these are daily records. They can all be compared with mentioned other means. And lastly, now we have instruments measuring constantly, plus the satellites. From all this, we build the picture of the past, and predictions of the future. The picture of the past is far more accurate, and shows us the correlations between climate and temperatures, and vegetation and ecosystems. You cannot look at climate alone without looking at the whole ecosystem.

And now, here is a pdf of a lecture at Helsinki university by an arctic researcher mr. Korhola. I snatched it off Helsinki Unis open website - the lecture notes usually are available for free here - we have free education also you see. Even at universities.

This pdf is very long, and it is packed with lots and lots of graphs mostly. Data about various climate factors, over thousands of years. From various researchers in various countries, including his own work. Most images have english captions/subtitles, some texts are in finnish only.

Please do see it all through and assimilate that data. No half assed replies about how impossible it is to know anything before checking that :)
http://tinyurl.com/67mxgw The pdf download link
Penguin
 
Posts: 5089
Joined: Thu Aug 23, 2007 5:56 pm
Blog: View Blog (0)

PreviousNext

Return to General Discussion

Who is online

Users browsing this forum: No registered users and 147 guests