Joe Hillshoist wrote:i dunno if the sun will be over the hills when the eclipse starts, and its got cloudy and rainy tonight, so i'm not 100% hopeful. i guess 7 or 8 hours will tell.
^ Greetings , Joe.
That was posted hoping others like you in Australia might notice and could take a look upward. There’ll be other marvels to see!
~ A.
Last edited by Allegro on Thu May 09, 2013 10:52 am, edited 1 time in total.
Art will be the last bastion when all else fades away. ~ Timothy White (b 1952), American rock music journalist _________________
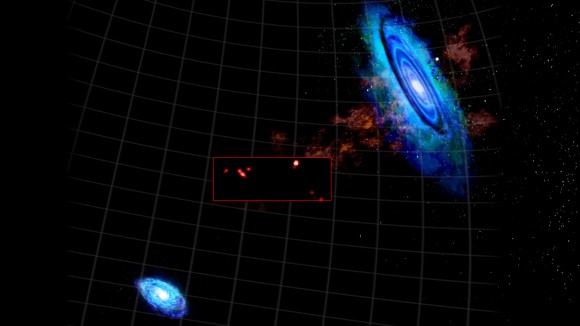
^ This combined graphic shows new, high-resolution GBT imaging (in box) of recently discovered hydrogen clouds between M31 (upper right) and M33 (bottom left). Credit: Bill Saxton, NRAO/AUI/NSF.
Score another point for the National Science Foundation’s Green Bank Telescope (GBT) at the National Radio Astronomy Observatory (NRAO) in Green Bank. They have opened our eyes – and ears – to previously undetected region of hydrogen gas clouds located in the area between the massive Andromeda and Triangulum galaxies. If researchers are correct, these dwarf galaxy-sized sectors of isolated gases may have originated from a huge store of heated, ionized gas… Gas which may be associated with elusive and invisible dark matter.
“We have known for some time that many seemingly empty stretches of the Universe contain vast but diffuse patches of hot, ionized hydrogen,” said Spencer Wolfe of West Virginia University in Morgantown. “Earlier observations of the area between M31 and M33 suggested the presence of colder, neutral hydrogen, but we couldn’t see any details to determine if it had a definitive structure or represented a new type of cosmic feature. Now, with high-resolution images from the GBT, we were able to detect discrete concentrations of neutral hydrogen emerging out of what was thought to be a mainly featureless field of gas.”
So how did astronomers detect the extremely faint signal which clued them to the presence of the gas pockets? Fortunately, our terrestrial radio telescopes are able to decipher the representative radio wavelength signals emitted by neutral atomic hydrogen. Even though it is commonplace in the Universe, it is still frail and not easy to observe. Researchers knew more than 10 years ago that these repositories of hydrogen might possibly exist in the empty space between M33 and M32, but the evidence was so slim that they couldn’t draw certain conclusions. They couldn’t “see” fine grained structure, nor could they positively identify where it came from and exactly what these accumulations meant. At best, their guess was it came from an interaction between the two galaxies and that gravitational pull formed a weak “bridge” between the two large galaxies.
^ The animation demonstrates the difference in resolution from the original Westerbork Radio Telescope data (Braun & Thilker, 2004) and the finer resolution imaging of GBT, which revealed the hydrogen clouds between M31 and M33. Bill Saxton, NRAO/AUI/NSF Credit: Bill Saxton, NRAO/AUI/NSF.
Just last year, the GBT observed the tell-tale fingerprint of hydrogen gas. It might be thin, but it is plentiful and it’s spread out between the galaxies. However, the observations didn’t stop there. More information was gathered and revealed the gas wasn’t just ethereal ribbons – but solid clumps. More than half of the gas was so conspicuously aggregated that they could even have passed themselves off as dwarf galaxies had they a population of stars. What’s more, the GBT also studied the proper motion of these gas pockets and found they were moving through space at roughly the same speed as the Andromeda and Triangulum galaxies.
“These observations suggest that they are independent entities and not the far-flung suburbs of either galaxy,” said Felix J. Lockman, an astronomer at the NRAO in Green Bank. “Their clustered orientation is equally compelling and may be the result of a filament of dark matter. The speculation is that a dark-matter filament, if it exists, could provide the gravitational scaffolding upon which clouds could condense from a surrounding field of hot gas.”
And where there is neutral hydrogen gas, there is fuel for new stars. Astronomers also recognize these new formations could eventually be drawn into M31 and M33, eliciting stellar creation. To add even more interest, these cold, dark regions which exist between galaxies contain a large amount of “unaccounted-for normal matter” – perhaps a clue to dark matter riddle and the reason behind the amount of hydrogen yet to revealed in universal structure.
“The region we have studied is only a fraction of the area around M31 reported to have diffuse hydrogen gas,” said D.J. Pisano of West Virginia University. “The clouds observed here may be just the tip of a larger population out there waiting to be discovered.”
There was an excitement after reading Sean Carroll’s feature that introduced me to “A Boy and His Atom.” I couldn’t contain the quiet signal of excitement, as usual, I got up from the desk to go outside and feel the breezes moving, watch clouds moving, watch branches moving, watch red birds and squirrels and blue birds moving about. Isn’t that a good metaphor for ones who feel even a faint excitement?
Anyway, as you’ll see, scientists used sounds as they strung together the film’s sequence of frames. The scientists, who were listening to sounds of atoms while the atoms were being moved around, showed some excitement on their faces, and then I knew that they knew they were demonstrating something we all could research, too. Sonifications, for instance. (There was also a quick, blub sound that ended on some tone higher than its start, and was heard just prior to the background noise that’s mentioned by the scientists. Seemingly, that blub wasn’t distinguished by the scientists, so, at the moment, I’m guessing the sound was a standard computer default.)
In the next comment space is the vimeo presentation by the director of “A Boy and His Atom.” His vimeo notes describe in some detail the film’s production, which was no small venture.
^ A Boy and His Atom | The World’s Smallest Movie
^ Moving Atoms | Making the World’s Smallest Movie One scientist said, “If I could do this by making a movie, and I can get a thousand kids to join science rather than go into law school, I’d be super happy.” YYYes!
An excerpt from the video directly ^ above
^ Excerpt: the Sound of Moving Atoms | Making the World’s Smallest Movie
Art will be the last bastion when all else fades away. ~ Timothy White (b 1952), American rock music journalist _________________
^ A Boy And His Atom | The World’s Smallest Movie posted 1 week ago by Nico Casavecchia
VIMEO NOTES. Directed by Nico Casavecchia Production company: 1st Avenue Machine Agency: Ogilvy & Mather Animation studio: Punga.tv
My name is Nico Casavecchia and I am a filmmaker.
In November 2012, I received the most interesting commission of my career as a director. To work with a team of IBM scientists to create the smallest movie in film history. The idea was to use a “Scanning tunneling microscope”, a tool that allows scientists to visualize and move individual atoms over a surface, to create a movie in stop motion.
As soon as we started, the challenges began to come forward. The first challenge was to create a common language between the scientists and the artists. After long hours of research and conference calls we started to understand the tools in the lab and the process of Andreas Heinrich and his team of scientists in California. Through this, we were able to define the limitations of the project. We had to create a film using no more than 5000 movements of single atoms, which was a huge limitation for the character design. Every element in the animation had to be very economic, so when it moved, it used the least amount of operations by frame. The second challenge arose from learning that atoms cannot be aligned orthogonally like the pixels of a computer screen, they have to be organized hexagonally like the bricks on a wall. This defined the kind of characters that we could create, their movements and the kind of story we could tell.
Once we knew the rules of the game we started thinking about stories that could be told within those boundaries. With Ogilvy & Mather New York, we arrived to the script of “A boy and his atom”. The agency wanted a story that could be understood by any culture, without words, which could express emotions. Our objective was to tell something using such small amount of pixels and a single color. This led us to research 8bits video games from the 80s, that told amazing stories with such limited resources, like a space battle with only a small amount of pixels.
The next step was to travel to Buenos Aires, where together with the production team of Punga, we designed the characters and the animation that the scientists used as reference. After that, I returned to New York where a programmer created a software that allowed us to translate the Punga created animation into a language that the scientist’s computer could understand.
In San José, California, we met with the scientists right before starting the next phase of the process. During that week I worked with Andreas and his team organizing the finite details. When I came back to New York, the group of scientists began their work. For over a month, they made shifts to create the smallest stop motion film in the world. When that was finished we reconstructed the animation frame by frame without adding any post production details, using just the images created in the lab.
The process of creating “A boy and his atom” was a collaboration of an incredible group of people. From the team in 1stAveMachine, the production company in charge of the movie, Punga, the Argentinian animation studio who did the animation, Ogilvy & Mather, the agency and especially Andreas Heinrich and his team in IBM.
Art will be the last bastion when all else fades away. ~ Timothy White (b 1952), American rock music journalist _________________
Still another way to distinguish the astronomical scales of things: Astronomers from the Sloan Digital Sky Survey collaborated for sorting by color 183,487 galaxies from their survey. Do you know where your marbles are?
Editor’s Note: This guest post was written by Markus Pössel, a theoretical physicist turned astronomical outreach scientist. He is the managing scientist at the Centre for Astronomy Education and Outreach “Haus der Astronomie” in Heidelberg, Germany.
When it comes to immediate and widespread appeal, astronomical diagrams have it tough. There’s a reason we have Most Awesome Space Images of 2012, but not “Astronomy’s coolest diagrams 2012.” But arguably, diagrams (more concretely: plots that help us visualize one or more physical quantities) are the key to understanding what’s up with all those objects whose colorful images we know and love.
To be sure, some diagrams have become quite famous. Take the Hubble diagram plotting galaxies’ redshifts against their distances: Its earliest version marks the discovery that we live in an expanding universe. A more recent incarnation, which shows how cosmic expansion is accelerating, won its creators the 2011 Nobel prize in physics.
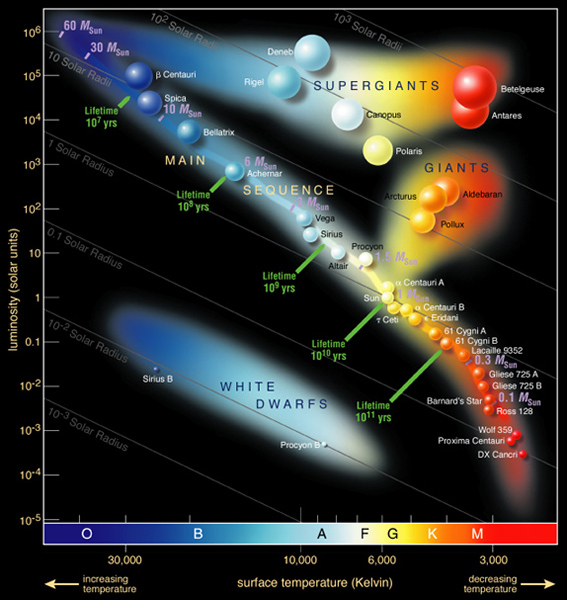
Another famous diagram is the Hertzsprung-Russell diagram (HR diagram, for short, shown above.) A single star doesn’t tell you all that much about stars in general. But if you plot the brightnesses and colors of many stars, patterns begin to emerge – such as the distinctive broad band of the “main sequence” bisecting the HR diagram diagonally, the realm of the giants and supergiants to its upper right and the White Dwarfs below on the left.
When astronomers first recognized those patterns, they took the first steps towards our modern understanding of how stars evolve over time.
The first HR diagram was published by the US astronomer Henry Norris Russell in 1913 (or at least described in words, if you look at the article); Hubble’s first diagram in 1929. Off the top of my head, I cannot think of any famous astronomical plot with more recent roots.
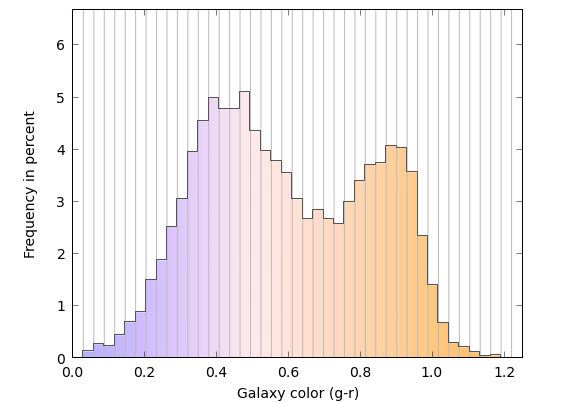
But that doesn’t mean there aren’t some plots that by rights should be famous. Here’s my rendition of what, back in 2003, must have been one of the first comprehensive examples of its kind (from this article by Blanton et al. 2003). The diagram shows the colors of many different galaxies, and how frequently or less frequently one encounters galaxies with those particular colors:
If you’re not familiar with this type of plot, it’s best to think of the vertical lines as dividing the diagram into bins – think “glass cylinders you can put stuff in.” Next, obtain a sample of images of distant galaxies. Here are some that I retrieved with the Skyserver Tool kindly provided by the folks who produced the Sloan Digital Sky Survey (SDSS) — a huge survey that, in its latest data release, lists more than 1.4 million galaxies:
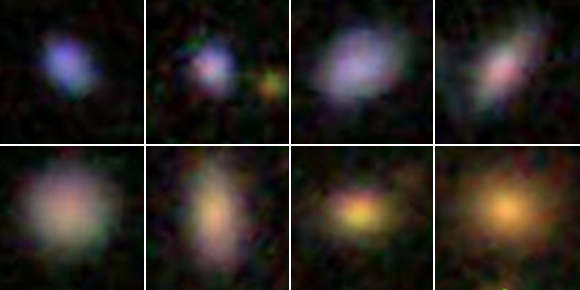
^ Galaxies from the Sloan Digital Sky Survey.
If these images are less detailed than what you’re used to, it’s because the galaxies are very far away even by extragalactic standards — their light takes almost 1.3 billion years to reach us. Even so, you can readily distinguish the galaxies’ different colors.
With that information, back to our (glass) bins. Think of the differently colored galaxies as differently colored marbles. Each bin accepts galaxies of one particular shade of color – so put each marble into the appropriate bin! As you do, some of the bins will fill up more, some less. The colored bars indicate each bin’s filling level. On the scale to the left, you can read off the corresponding numbers. For instance, the best-filled bin contains a little more than 5 percent of all the galaxy-marbles.
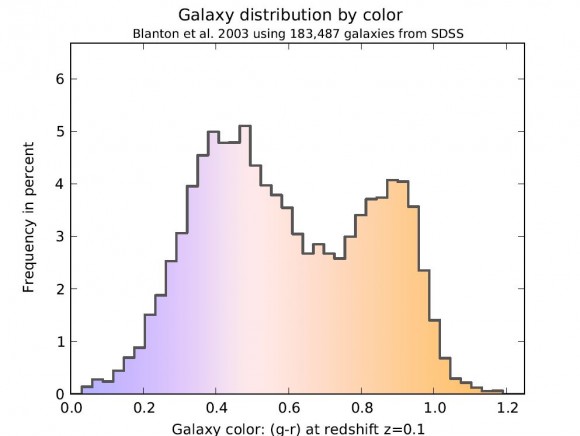
Now that you know how to read the diagram, let’s remove the extra vertical lines. In a paper published in an astronomical research journal, this is what a “histogram” of this kind would look like:
^ Galaxy distribution by color. Credit: Markus Pössel
I’ve left the coloring in even though you’d probably not find it in an astronomical paper. The astronomers’ own measure of color, denoted “g-r” on the horizontal axis, is a bit technical — let’s ignore those details and stick with the colors we see in the diagram.
To fill the bins in this particular diagram, the astronomers from the SDSS collaboration sorted 183,487 galaxies from their survey by color.
So what does the diagram tell us? Evidently, there are two peaks: one near the bluish end on the left, one near the reddish end on the right. That indicates two distinct types of galaxies. Galaxies of the first kind are, on average, of a bluish-white color, with some specimens a little more and some a little less blue (which is why the peak is a little broad). Galaxies of the other kind are, on average, much redder.
A galaxy’s color derives from its stars. A bluish galaxy is one with bluish stars. Bluish stars are hotter than reddish ones. (Think of heating metal: It starts out a dull red, becomes orange, then white-hot; if you could make metal even hotter, it would radiate bluish.) Hot stars are more massive than cooler stars, and they live fast and die young — the most massive ones die after much less than a million years, a fleeting moment compared with our Sun’s estimated lifetime of ten billion years. For a galaxy to glow an overall blue, it must have a steady supply of these short-lived bluish stars, producing new blue stars in sufficient quantities as the old ones burn out. So evidently, the galaxies of the bluish kind are continually producing new bluish stars. Since there is no known mechanism that makes a galaxy produce only bluish stars, we can drop the qualifier: these galaxies are continually producing new stars.
The reddish galaxies, on the other hand, produce hardly any new stars. If they did, then by all we know about star formation there should be sufficient bluish stars around to give these galaxies an overall bluish tint. Without any new stars, all that is left are long-lived, less massive stars, and those tend to be cooler and more reddish.
The existence of two distinct classes of galaxies — star-forming vs. “red and dead” — is a driving force behind current research on galaxy evolution in much the same way the HR diagram was for stellar evolution. Why are there two distinct kinds? What makes the bluish galaxies produce stars, and what prevents the reddish ones? Do galaxies move from one camp to the other over time? And if yes, how and in which direction? When you read an article like this about the care and feeding of teenage galaxies, or this one about galaxies recycling their gas, it’s all about astronomers trying to find pieces of the puzzle of why there are these two populations.
This diagram clearly deserves wider public recognition. And no doubt there are many other, equally under-appreciated astronomical plots. Please help me give them some of the recognition they deserve: Which diagrams have done the most to increase your understanding of what’s out there? Which have surprised you? Which have sent a thrill down your spine? Please post a link or a description, and let’s see if we can create a “Top 10″ list of astronomical diagrams. And who knows: We might even try for an “Astronomy’s coolest diagrams 2013″ at the end of the year.
_________________
Additional information about how the two-peak galaxy diagram was made, including different versions for download and the python script that produced it, can be found here. If you do want to know about the technical details about the color: The values on the x axis correspond to g-r, where g is the star’s brightness (expressed in the usual astronomical magnitude system) through one particular greenish filter and r the brightness through one particular reddish filter. Details about the ugriz filter system used can be found on this SDSS page. And in case you’re worrying about the effect cosmic redshift might have had on the galaxies in the sample: the astronomers took care to compensate for that particular effect, correcting the colors to appear as they would if each of the galaxies were so far away that its light would take 1.29 billion years to reach us (that is, at a cosmic redshift of z=0.1).
Many thanks to Kate H.R. Rubin for pointing me to the galaxy diagram and for helpful discussions.
Art will be the last bastion when all else fades away. ~ Timothy White (b 1952), American rock music journalist _________________
Squishy Eclipse | Phil Plait Bad Astronomy | Thursday, May 9, 2013, at 7:49 PM
I’ve seen a lot of eclipse pictures, but this one is pretty phenomenally cool:
^ The rising Sun, eclipsed by the Moon, with both flattened due to atmospheric distortion. Click to penumbranate. Photo by Geoff Sims, used by permission
But this one is even better. On average, the Sun and Moon are the same size in the sky, but the Moon’s orbit is an ellipse, and it happened to be near the farthest point on it orbit (called apogee) when it passed in front of the Sun. That made it appear smaller, so it couldn’t cover the entire Sun’s disk, leaving the “ring of fire” around the silhouetted Moon.
But Sims caught the eclipse near sunrise*, when the Moon and Sun were on the horizon. Atmospheric effects bend the light from the Sun, squashing it, and making this already weird eclipse that much more bizarre.
Sims promised me he has more pictures coming, so I’m excited to see what he has. If they’re anything like this, they’ll be fun to see.
Correction (May 10, 00:04 UTC): Oops. I originally said this was at sunset, but it was actually at sunrise. I wrote this with the Sun setting outside my western-facing office window, and that threw me!
Art will be the last bastion when all else fades away. ~ Timothy White (b 1952), American rock music journalist _________________
Joe Hillshoist wrote:i dunno if the sun will be over the hills when the eclipse starts, and its got cloudy and rainy tonight, so i'm not 100% hopeful. i guess 7 or 8 hours will tell.
^ Greetings , Joe.
That was posted hoping others like you in Australia might notice and could take a look upward. There’ll be other marvels to see!
~ A.
It was very cloudy, and slightly dull.
You know what tho, whatever the cloud situation whenever I've been at home when there is an eclipse the birds all shut up. They go silent.
^ Yeah, Joe. When I was a kid, dad would take me by the hand, and we'd go outside to watch the dark clouds for signs of a tornado. The eerie thing was there were no breezes that I remember and no sounds of birds. I guess I thought birds were taking naps or had gone to their homes to sleep. Now that I think about it, I don't recall paying attention for sounds of birds after the darkened sky had become bright again. They probably started their flights and songs where they left off .
Art will be the last bastion when all else fades away. ~ Timothy White (b 1952), American rock music journalist _________________
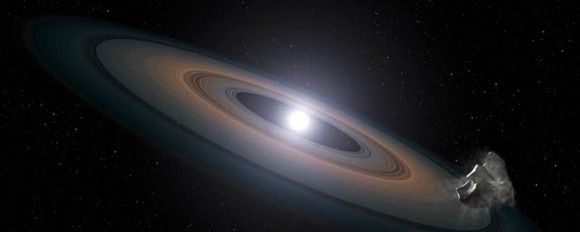
^ Artist Impression of debris around a white dwarf star. Image credit: NASA, ESA, STScI, and G. Bacon (STScI)
For those of us who practice amateur astronomy, we’re very familiar with the 150 light-year distant Hyades star cluster – one of the jewels in the Taurus crown. We’ve looked at it countless times, but now the NASA/ESA Hubble Space Telescope has taken its turn observing and spotted something astronomers weren’t expecting – the debris of Earth-like planets orbiting white dwarf stars. Are these “burn outs” being polluted by detritus similar to asteroids? According to researchers, this new observation could mean that rocky planet creation is commonplace in star clusters.
“We have identified chemical evidence for the building blocks of rocky planets,” said Jay Farihi of the University of Cambridge in England. He is lead author of a new study appearing in the Monthly Notices of the Royal Astronomical Society. “When these stars were born, they built planets, and there’s a good chance they currently retain some of them. The material we are seeing is evidence of this. The debris is at least as rocky as the most primitive terrestrial bodies in our solar system.”
So what makes this an uncommon occurrence? Research tells us that all stars are formed in clusters, and we know that planets form around stars. However, the equation doesn’t go hand in hand. Out of the hundreds of known exoplanets, only four are known to have homes in star clusters. As a matter of fact, that number is a meager half percent, but why? As a rule, the stars contained within a cluster are young and active. They are busy producing stellar flares and similar brilliant activity which may mask signs of emerging planets. This new research is looking to the “older” members of the cluster stars – the grandparents which may be babysitting.
To locate possible candidates, astronomers have employed Hubble’s Cosmic Origins Spectrograph and focused on two white dwarf stars. Their return showed evidence of silicon and just slight levels of carbon in their atmospheres. This observation was important because silicon is key in rocky materials – a prime ingredient on Earth’s list and other similar solid planets. This silicon signature may have come from the disintegration of asteroids as they wandered too close to the stars and were torn apart. A lack of carbon is equally exciting because, while it helps shape the properties and origins of planetary debris, it becomes scarce when rocky planets are formed. This material may have formed a torus around the defunct stars which then drew the matter towards them.
“We have identified chemical evidence for the building blocks of rocky planets,” said Farihi. “When these stars were born, they built planets, and there’s a good chance they currently retain some of them. The material we are seeing is evidence of this. The debris is at least as rocky as the most primitive terrestrial bodies in our solar system.”
Ring around the rosie? You bet. This leftover material swirling around the white dwarf stars could mean that planet formation happened almost simultaneously as the stars were born. At their collapse, the surviving gas giants may have had the gravitational “push” to relocate asteroid-like bodies into “star-grazing orbits”.
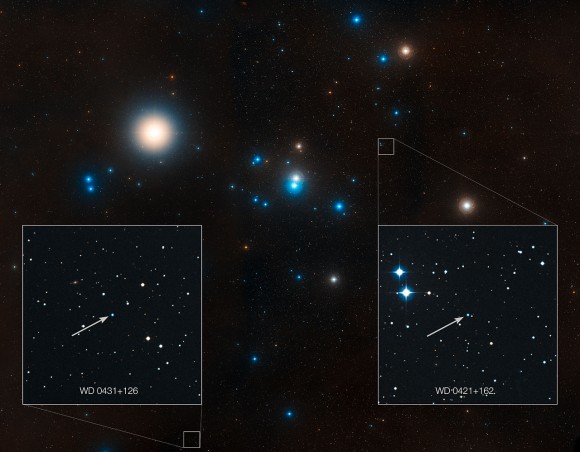
^ This image shows the region around the Hyades star cluster, the nearest open cluster to us. The Hyades cluster is very well-studied due to its location, but previous searches for planets have produced only one. A new study led by Jay Farihi of the University of Cambridge, UK, has now found the atmospheres of two burnt-out stars in this cluster — known as white dwarfs — to be “polluted” by rocky debris circling the star. Inset, the locations of these white dwarf stars are indicated — stars known as WD 0421+162, and WD 0431+126. Credit: NASA, ESA, STScI, and Z. Levay (STScI)
“We have identified chemical evidence for the building blocks of rocky planets,” explains Farihi. “When these stars were born, they built planets, and there’s a good chance that they currently retain some of them. The signs of rocky debris we are seeing are evidence of this — it is at least as rocky as the most primitive terrestrial bodies in our Solar System. The one thing the white dwarf pollution technique gives us that we won’t get with any other planet detection technique is the chemistry of solid planets. Based on the silicon-to-carbon ratio in our study, for example, we can actually say that this material is basically Earth-like.”
What of future plans? According to Farihi and the research team, by continuing to observe with methods like those employed by Hubble, they can take an even deeper look at the atmospheres around white dwarf stars. They will be searching for signs of solid planet “pollution” – exploring the white dwarf chemistry and analyzing stellar composition. Right now, the two “polluted” Hyades white dwarfs are just a small segment of more than a hundred future candidates which will be studied by a team led by Boris Gansicke of the University of Warwick in England. Team member Detlev Koester of the University of Kiel in Germany is also contributing by using sophisticated computer models of white dwarf atmospheres to determine the abundances of various elements that can be traced to planets in the Hubble spectrograph data.
“Normally, white dwarfs are like blank pieces of paper, containing only the light elements hydrogen and helium,” Farihi said. “Heavy elements like silicon and carbon sink to the core. The one thing the white dwarf pollution technique gives us that we just won’t get with any other planet-detection technique is the chemistry of solid planets.”
The team also plans to look deeper into the stellar composition as well. “The beauty of this technique is that whatever the Universe is doing, we’ll be able to measure it,” Farihi said. “We have been using the Solar System as a kind of map, but we don’t know what the rest of the Universe does. Hopefully with Hubble and its powerful ultraviolet-light spectrograph COS, and with the upcoming ground-based 30- and 40-metre telescopes, we’ll be able to tell more of the story.”
Allegro wrote:^ Yeah, Joe. When I was a kid, dad would take me by the hand, and we'd go outside to watch the dark clouds for signs of a tornado. The eerie thing was there were no breezes that I remember and no sounds of birds. I guess I thought birds were taking naps or had gone to their homes to sleep. Now that I think about it, I don't recall paying attention for sounds of birds after the darkened sky had become bright again. They probably started their flights and songs where they left off .
In 1878, the Wyoming chicken coop Edison was using to house the scientific instruments with which he intended to observe a total eclipse was invaded by hens coming home to roost prematurely.
Astrophoto: The Macro Moon Universe Today, Nancy Atkinson | May 13, 2013
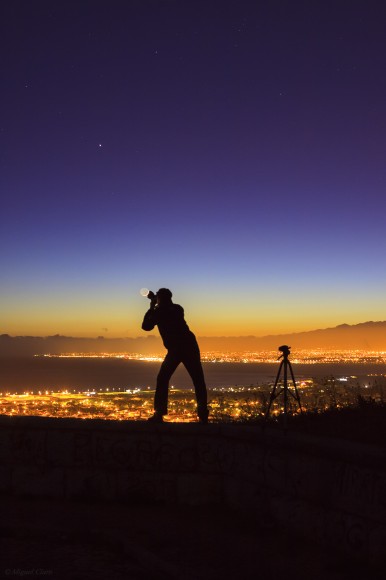
^ A ‘macro’ shot of the crescent Moon? Photographer Miguel Claro appears to be taking a closeup shot of the crescent Moon, with an added Earthshine effect. Jupiter joins the scene as the brightest ‘star’ in the sky. Credit and copyright: Miguel Claro.
This very creative self-portrait by astrophotographer Miguel Claro shows what appears to be the photographer taking a ‘macro’ closeup of the crescent Moon! But there is a lot more going on in this image. The crescent Moon has just 3% of the disc illuminated by the Sun, but there is a stunningly bright Earthshine effect visible. This image was taken on May 11, 2013, so there is a conjunction between the Moon and Jupiter (the brightest star in the image). Venus was also in conjunction, but at the time this image was taken, it was covered by the cloudy band low on the horizon.
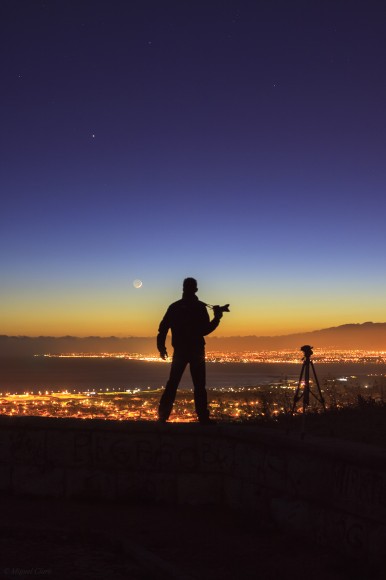
Another shot below:
^ A silhouette of photographer Miguel Claro along with the crescent Moon and Jupiter. Credit and copyright: Miguel Claro.
Images taken from Capuchos, Almada, Portugal with a Canon 50D – ISO400; Exp. 2sec. F/4; 35mm, on May 11, 2013 at 21:41 and 21:43. Enjoy more of Claro’s images at his website.
Art will be the last bastion when all else fades away. ~ Timothy White (b 1952), American rock music journalist _________________
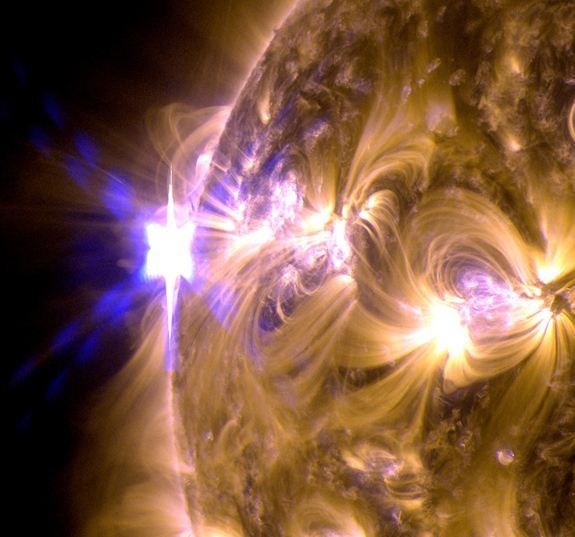
^ A close-up of an an X1.7-class solar flare on May 12, 2013 as seen by NASA’s Solar Dynamics Observatory. Credit: NASA/SDO/AIA. Click for larger version.
The Sun gets active! On May 12, 2013, the Sun emitted what NASA called a “significant” solar flare, classified as an X1.7, making it the first X-class flare of 2013. Then earlier today, May 13, 2013, the Sun let loose with an even stronger flare, an X2.8-class. Both flares took place just beyond the limb of the Sun, and were also associated with another solar phenomenon, a coronal mass ejection (CME) which sent solar material out into space.
Neither CME was not Earth-directed, and according to SpaceWeather.com, no planets were in the line of fire. However, the CMEs appear to be on course to hit NASA’s Epoxi, STEREO-B and Spitzer spacecraft on May 15-16. NASA said their mission operators have been notified, and if warranted, operators can put spacecraft into safe mode to protect the instruments. Experimental NASA research models show that the CMEs were traveling at about 1,930 km/second (1,200 miles per second) when they left the Sun.
The sunspot associated with these flares is just coming into view, and the next 24 to 48 hours should reveal much about the sunspot, including its size, magnetic complexity, and potential for future flares.
See more images and video below.
Both the X1.7 and the X2.8-class solar flare, plus a prominence eruption, all in one video:
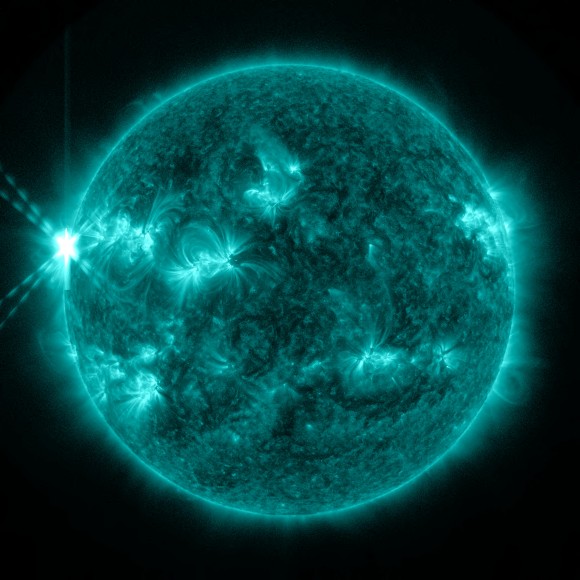
^ SDO image of an X2.8-class flare on May 13, 2013. Credit: NASA/SDO
NASA’s Solar Dynamics Observatory (SDO) captured this X1 flare (largest of the year so far) in extreme UV light:
Art will be the last bastion when all else fades away. ~ Timothy White (b 1952), American rock music journalist _________________


 your marbles are?