Scientism is a real problem but it doesn't mean that all human knowledge is unreliable or corrupted and something to toss out at one's ideological convenience.
In my mind, that's the problem—when people choose to decide that "science is not trustworthy" when that stance supports a political view—not just party politics but the entire picture of how we use resources and design a society.
There's a deliberate effort going on to make people doubt the value of human knowledge, so that some narrow interest may be served by replacing a rationally produced map of how things work with a bogus map that leads us down some desired path—typically into the jaws of a shark.
Once people are persuaded to hold faith in nothing, they're primed to believe anything. Stripped of their senses, they are blinded, and to live they must be led around and have the world described to them. At that point, the more they like what they hear, the more they'll believe it.
A funny irony is that those pushing know-nothingness are using science to spread it.
Coronavirus Crisis: Main Thread
Moderators: Elvis, DrVolin, Jeff
-
Elvis

- Posts: 7588
- Joined: Fri Apr 11, 2008 7:24 pm
Re: Coronavirus Crisis: Main Thread
“The purpose of studying economics is not to acquire a set of ready-made answers to economic questions, but to learn how to avoid being deceived by economists.” ― Joan Robinson
-
liminalOyster

- Posts: 1892
- Joined: Thu May 05, 2016 10:28 pm
- spambot: no
Re: Coronavirus Crisis: Main Thread
Mark Mothersbaugh nearly died from COVID-19. FaceTiming with his family kept him alive
By RANDALL ROBERTSSTAFF WRITER
AUG. 31, 202010:36 AM
As Mark Mothersbaugh lay in a Cedars-Sinai hospital bed in early June after contracting the novel coronavirus, a ventilator tube snaking into his throat to help him breathe, the Devo cofounder and acclaimed film and TV composer came to believe that he was recovering from a vicious beating in downtown Los Angeles.
“There’s a bookstore I love there where I get stationery supplies, and in my mind I had been there,” Mothersbaugh, 70, said Thursday afternoon, sitting on the patio of the Hollywood Hills home he shares with his wife, Anita Greenspan, and two teenage daughters. “I was convinced for about two weeks that I had been hit by a brick by somebody in Little Tokyo.”
Wearing chrome-framed eyeglasses, his nose and mouth covered by a black mask branded with the logo of his Mutato Musika commercial music company, Mothersbaugh touched his right temple while recalling the experience, as if searching for a head wound.
“I felt blood from being hit. I was handcuffed to a parking deck downtown. I had this whole elaborate story of how these kids sold me to an ambulance company that then got some sort of a payment for delivering COVID patients to their ICUs. I totally believed it,” he said.
Mothersbaugh’s delusions lasted more than two weeks during his time both on and off the ventilator. In fact, the artist didn’t contract the virus that causes COVID-19 while shopping in Little Tokyo. He caught it shuttling between his house and his Sunset Strip offices and studios in late May. His family was in Palm Springs. After he tested positive, he insisted on isolating by himself.
Three harrowing months later, Mothersbaugh and his family are back together and virus free. His experience, he says, was devastating. It was also unfortunately instructive, as it confirms an argument that he and his groundbreaking band, Devo, have been making for nearly 50 years.
“Everything’s become more devolved than I would have imagined possible,” he said. “For anybody that’s doubting whether the coronavirus and COVID-19 is real, it’s really real.”
He’s seen the doubters first hand. As he was recovering at home, a houseful of TikTok influencers across the street threw massive parties despite the shutdown and made news when Mayor Eric Garcetti shut off the property’s power. De-evolution is really real too.
Adjusting his mask, Mothersbaugh recalled the circumstances that led to his hospitalization.
He’d been taking the coronavirus seriously, he said. As news spread of its dangers, he’d avoided in-studio recording sessions for the four animated films he’d been scoring, instead conferencing in to observe and consult. But still, on at least one occasion near the end of May while working at Mutato, he unintentionally found himself in the company of a number of people he didn’t know.
When symptoms arrived a few days later, he thought his exhaustion was from juggling too many things at once. Then he took his temperature. It read 103. At first he thought he was reading the thermometer wrong. He told his wife, and she immediately started making calls.
Recalls Mothersbaugh, “A nurse came over the next morning and said, ‘You should be in ICU.’ I said, ‘That’s ridiculous.’ She replied that she’d been a nurse for three decades: ‘You need an ambulance right now.’”
From Greenspan’s perspective, the virus steamrolled through her husband’s system. “It went from, ‘I don’t feel good’ on Tuesday to an ambulance to Cedars on Saturday. It was terrifying.” She believes that the nurse, Patricia Lineweaver, saved Mothersbaugh’s life.
Mothersbaugh spent much of the next 18 days on his back, tilted up in his hospital bed in the intensive care unit. Isolated, like all of those infected with the virus, from everyone except essential medical personnel, he lost all track of time and space. Tubes and machines cuffed him in place. At one point, he tried to break free of all the stuff attached to him and they had to secure his arms and legs.
During video calls with Greenspan and their daughters, 19-year-old Hui Hui and Margaret, 16, Mothersbaugh pressed them for information about the Little Tokyo brick-throwing incident. Had they found his attackers? Did they have any suspects? “Some of the delusions were very dark,” Mothersbaugh recalled. “Like, ‘Oh no, I have to get out of this place.’”
As he drifted in and out of consciousness, he remembers “a lot of people coming in on stretchers and people going out on stretchers.”
Another extended departure from reality involved Devo, the band he cofounded at Kent State after four students were killed by National Guard members in 1970.
While attached to the ventilator, he said: “I wrote a whole new Devo album and put together a whole live show.” In his hallucination, the band performed it on the streets of Hollywood — through the use of augmented reality. “We were standing on top of these projections, which were growing somehow.”
In reality, while Mothersbaugh was fighting for his life, in the outside world, Devo’s trademark “energy domes,” the flower pot-shaped red headgear the band wore during its early 1980s peak, were becoming a meme on social media. Someone at the company that manufacturers the domes realized that another of its products, plastic face shields, could easily be affixed to the hats to create a Devo dome-shield.
As both the meme and the virus advanced, Greenspan and their daughters kept a constant vigil through video calls.
During one crucial moment, Mothersbaugh believes they helped him stay tethered to the present.
His voice turning soft, he remembered “a time where I just felt exhausted. Like, ‘I could just float down this river right now, and it would be really peaceful. It wouldn’t be a freak-out. It wouldn’t be something I’d be scared of. I could really just do that.’ I really thought about it.
“And then it just happened that [Greenspan] called me, and she and the kids were on my phone, saying, ‘You’re getting out of there soon. Get off of that machine.’ I don’t know if everybody is lucky enough to have somebody do that for them.”
For Mothersbaugh, the message he most wants to convey is: “If you have anyone that you know who’s in ICU with COVID, contact them and keep them in touch with the outside world, because it’s easy to lose track of where you are and why you are. I had no idea I was on a ventilator for 10 days. Time meant nothing.”
Greenspan said that when the nurses finally removed the ventilator tube from her husband’s mouth, the first thing he said was, “Has anybody seen my glasses?”
Nearly two months after being discharged, the TikTokkers are gone and Mothersbaugh is back at work. He says he’s still feeling a few fading after-effects. Holding out his left hand, which is trembling slightly, he described “a little thing with my nerves.” Worse, though, is the overall physical toll, which he described as “creepy.”
“Before COVID, I was like, ‘Yeah, I’m starting to feel about 50 now, and I’m 70.’ When I was in the hospital, I was feeling like I was about 90. And now I’m back to 70, and I’m trying to get back to 50. That’s my goal.”
He says he’s been recovering by completing a visual art project he’s spent decades working on, one involving his long history in postcard art. In collaboration with artist Beatie Wolfe, Mothersbaugh has launched Postcards for Democracy, which the two describe as “a demonstration to support the 225-year-old U.S. Postal Service and the right to vote.” The aim is to help fund the Postal Service in advance of the November election.
Sighing through his face mask, Mothersbaugh said, “I remember at the end of 2019 talking to somebody and saying, ‘You know, I think 2020 is going to be a whole lot better.’ It kind of cracks me up to think about now.”
He added, with a hint of feigned enthusiasm, “We’re all getting to live through a pandemic. Who would have thought?”
https://www.latimes.com/entertainment-a ... oronavirus
"It's not rocket surgery." - Elvis
-
Iamwhomiam

- Posts: 6572
- Joined: Thu Sep 27, 2007 2:47 am
Re: Coronavirus Crisis: Main Thread
^^^ Glad Mothersbaugh's still among the living.
~ Intermission ~
https://www.youtube.com/watch?v=Kp1paRWGYPY
~ Intermission ~
https://www.youtube.com/watch?v=Kp1paRWGYPY
-
Iamwhomiam
- Posts: 6572
- Joined: Thu Sep 27, 2007 2:47 am
Re: Coronavirus Crisis: Main Thread
Places with highest daily reported cases per capita Scroll down the page for:
Seven-day average of daily new reported cases per 100,000 residents
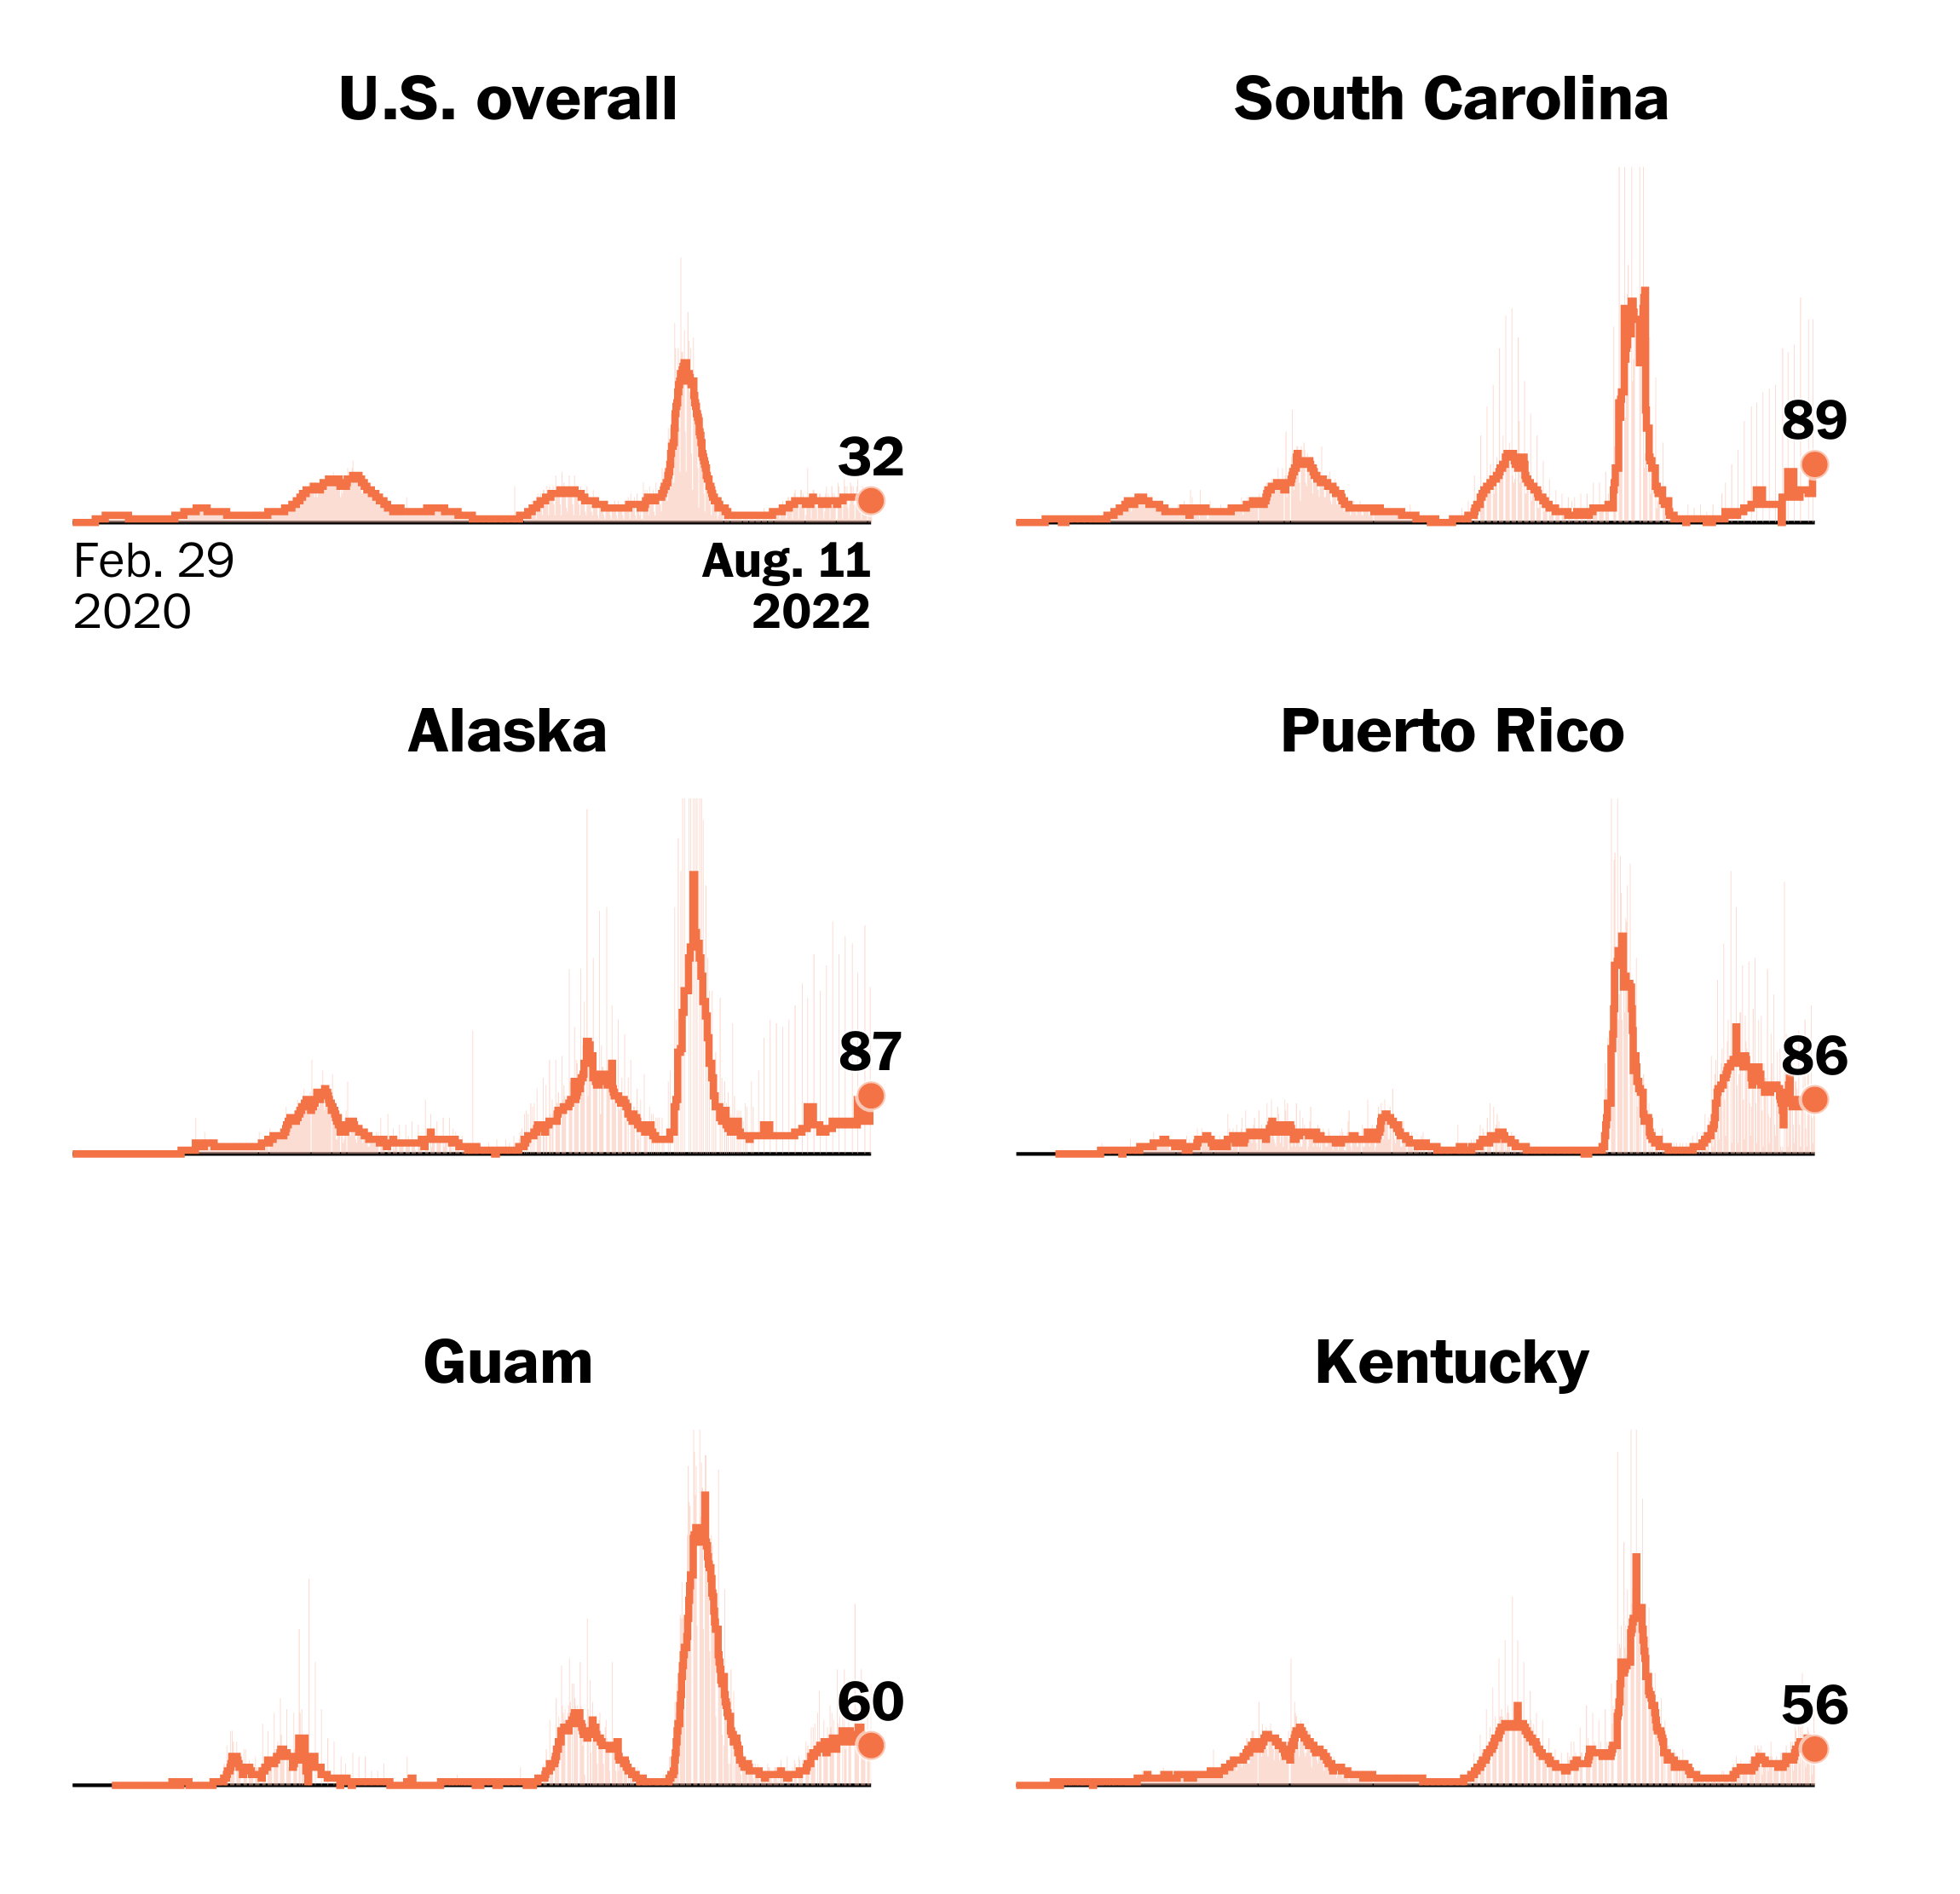
Track the spread: Across U.S. ~ Worldwide
Where states reopened and cases spiked
What readers want to know about coronavirus
(Ha! Get a load of their featured question. Here, one's confirmation bias will be tested.)
Seven-day average of daily new reported cases per 100,000 residents
Track the spread: Across U.S. ~ Worldwide
Where states reopened and cases spiked
What readers want to know about coronavirus
(Ha! Get a load of their featured question. Here, one's confirmation bias will be tested.)
-
Belligerent Savant

- Posts: 5624
- Joined: Mon Oct 05, 2009 11:58 pm
- Location: North Atlantic.
Re: Coronavirus Crisis: Main Thread
.
"cases". How many of these "cases" are asymptomatic or minimally symptomatic vs. more serious symptoms? I'd like to see such metrics, if they even exist.
[side-bar: to what extent do these numbers -- the tally of "cases" -- account for false-positives?]
This is a question for anyone out there.
"cases". How many of these "cases" are asymptomatic or minimally symptomatic vs. more serious symptoms? I'd like to see such metrics, if they even exist.
[side-bar: to what extent do these numbers -- the tally of "cases" -- account for false-positives?]
This is a question for anyone out there.
Last edited by Belligerent Savant on Sat Sep 05, 2020 2:15 pm, edited 1 time in total.
-
Iamwhomiam
- Posts: 6572
- Joined: Thu Sep 27, 2007 2:47 am
Re: Coronavirus Crisis: Main Thread
I suggest you write to the editor of the paper for the answer.
-
Belligerent Savant
- Posts: 5624
- Joined: Mon Oct 05, 2009 11:58 pm
- Location: North Atlantic.
Re: Coronavirus Crisis: Main Thread
.
"the paper". My question(s) apply to any/all reporting of "cases", beyond the citings of a single paper.
Are there any news sources tracking the percentage of asymptomatic/minimally symptomatic cases in these tallies? And further, tracking false-postive results?
These are questions that should be of critical interest to anyone following updates on this virus. Otherwise it's just another example of fear-mongering.
-
Iamwhomiam
- Posts: 6572
- Joined: Thu Sep 27, 2007 2:47 am
Re: Coronavirus Crisis: Main Thread
What is another example of fear mongering?
-
norton ash
- Posts: 4067
- Joined: Wed Nov 08, 2006 5:46 pm
- Location: Canada
Re: Coronavirus Crisis: Main Thread
Well I've been traumatized into wearing a mask to the grocery store. And of course FOMO, fear of missing out. They can monger, I'll only take the amount of fear I need.
Zen horse
-
Iamwhomiam
- Posts: 6572
- Joined: Thu Sep 27, 2007 2:47 am
Re: Coronavirus Crisis: Main Thread
Oh no, Norton, I was asking BS what he was referring to, as its unclear. I should have used quotation marks. I'll go back just a bit. BS asked of anyone a few questions in response to the Washington Post article I posted which were,
We do have politicians who are well paid to represent us and find the answers to such questions we might have, if you don't want to pose those questions to the wapo editor, BS, you might try writing to ask your questions of one of your elected representatives.
But no one but BS can explain what he was referring to as "just another case of fear mongering." I have no idea why he hasn't explained his statement. Please do, BS. And while you're at it, why not explain for us why your questions should be of critical interest to anyone.following updates on the virus? Personally, I'd like to see a tracking of recurrences that resulted in death and 2nd recurrences and their survival and death counts.
But Norton, the sources are all listed with their contact information at the end of the wapo article: I didn't embed all the email addresses>
https://www.washingtonpost.com/graphics ... es-deaths/
Because I posted the WAPO article, I suggested to BS that he should write the editor of the newspaper for help answering his questions, as he knew what sources he drew the article's information from I thought BS could ask him to seek out those answers for him from his article's sources if he couldn't answer his questions himself. But I think BS misunderstood my meaning in my writing "the editor of the paper" as he then wrote,"cases". How many of these "cases" are asymptomatic or minimally symptomatic vs. more serious symptoms? I'd like to see such metrics, if they even exist.
[side-bar: to what extent do these numbers -- the tally of "cases" -- account for false-positives?]
You see, writing to the editor of the (news)paper, I believe was misconstrued by BS to be the author of a paper published by a medical journal. Exactly what is "just another case of fear mongering" remains unanswered."the paper". My question(s) apply to any/all reporting of "cases", beyond the citings of a single paper.
Are there any news sources tracking the percentage of asymptomatic/minimally symptomatic cases in these tallies? And further, tracking false-postive results?
These are questions that should be of critical interest to anyone following updates on this virus. Otherwise it's just another example of fear-mongering.
We do have politicians who are well paid to represent us and find the answers to such questions we might have, if you don't want to pose those questions to the wapo editor, BS, you might try writing to ask your questions of one of your elected representatives.
But no one but BS can explain what he was referring to as "just another case of fear mongering." I have no idea why he hasn't explained his statement. Please do, BS. And while you're at it, why not explain for us why your questions should be of critical interest to anyone.following updates on the virus? Personally, I'd like to see a tracking of recurrences that resulted in death and 2nd recurrences and their survival and death counts.
But Norton, the sources are all listed with their contact information at the end of the wapo article: I didn't embed all the email addresses>
https://www.washingtonpost.com/graphics ... es-deaths/
Design and development by Leslie Shapiro, Youjin Shin and Chris Alcantara. Story by Bonnie Berkowitz. Kevin Schaul, Joe Fox, Brittany Renee Mayes, Jacqueline Dupree, Simon Glenn-Gregg, Erik Reyna, Susan Tyler, Lenny Bronner and Peter Andringa contributed to this report. Editing by Armand Emamdjomeh and Danielle Rindler. Contact the team at uscoronavirustracker@washpost.com.
About this story
Data on deaths and cases comes from Post reporting and Johns Hopkins University. Post-reported data, including hospitalizations, is gathered from state sites and from county and city sites for certain jurisdictions. Deaths are recorded on the dates they are announced, not necessarily the dates they occur. All numbers are provisional and may be revised by the jurisdictions.
The seven-day rolling average uses the past seven days of new daily reported cases or deaths to calculate a daily average, starting from the most recent full day of data.
Population data are five-year estimates from the 2018 American Community Survey by the U.S. Census Bureau.
State stay-at-home order data from Post reporting. State-of-emergency declarations were tallied by Boston University's covid-19 U.S. state policy database.
Testing data is from the Covid-19 Tracking Project.
Contact us at uscoronavirustracker@washpost.com.
Originally published March 27, 2020.
Recent changes on this page
August 24 Replaced the modeled trend with a more standard 7-day rolling average of new daily cases and deaths.
August 20 Added a module to show the aggregate statistics in the U.S. and each state/territory over the past week.
July 29 Added hospitalization data and other page improvements.
-
norton ash
- Posts: 4067
- Joined: Wed Nov 08, 2006 5:46 pm
- Location: Canada
Re: Coronavirus Crisis: Main Thread
Sorry Iam, I was joking about use of the phrase 'fear mongering.'
Zen horse
-
Belligerent Savant
- Posts: 5624
- Joined: Mon Oct 05, 2009 11:58 pm
- Location: North Atlantic.
Re: Coronavirus Crisis: Main Thread
.
Fear mongering is one of the default methodologies of conditioning and control by our govts, our mainstream press, our power structures. It's been applied heavily, broadly, since the onset of this virus.
My comment on 'fear mongering' is applied more generally when there are reports on 'cases' but no further breakdown of asymptomatic/mininally symptomatic percentages. It doesn't necessarily apply to the specific link you provided, but to me, without the added context of how those who test positive are actually enduring the positive result, it's of little value other than to create 'alarm' about increased/total case count.
Also, it appears an increased case count is now viewed, at least in mainstream reporting, as cause for alarm -- is that still the case? I ask because i've largely tuned out most readily available ('mainstream') sources on this topic.
Is 'herd immunity' now to be frowned upon? What is vaccination other than an induced herd immunity?
If the majority of positive cases are indeed asymptomatic/minimally symptomatic, why would more positive cases be a negative development, generally?
(Reaching herd immunity before a vaccine is ready -- is this a good or bad development? Could there be incentives to avoid this?)
How much longer are average humans going to be ok with these excessive lockdown measures, particularly given the continued negative impact to income, livelihood and health (deleterious mental and physical health) outside of COVID itself?
These are largely rhetorical questions to anyone/all.
*all of the above assumes testing criteria and tallies of positive cases and death counts are accepted as presented to us. We know there are cases of false positives and false negatives, and the criteria for determining a 'COVID death' remains in question ('with' vs 'of' COVID, etc), which in turn will skew numbers/percentages.
-
conniption
- Posts: 2480
- Joined: Sun Nov 11, 2012 10:01 pm
- spambot: no
Re: Coronavirus Crisis: Main Thread
RT
The 1% blunder: How a simple but fatal math mistake by US Covid-19 experts caused the world to panic and order lockdowns
6 Sep, 2020
By Malcolm Kendrick, doctor and author who works as a GP in the National Health Service in England. His blog can be read here and his book, 'Doctoring Data – How to Sort Out Medical Advice from Medical Nonsense,' is available here.
In February, US Covid guru Anthony Fauci predicted the virus was ‘akin to a severe flu’ and would therefore kill around 0.1 percent of people. Then fatality rate predictions were somehow mixed up to make it look ten times WORSE.
When you strip everything else out, the reason for lockdown comes from a single figure: one percent. This was the prediction that Covid, if left unchecked, would kill around one percent of us.
You may not think that percentage is enormous, but one percent of the population of the world is 70 million people – and that’s a lot. It would mean 3.2 million Americans dead, and 670,000 Britons.
But where did this one percent figure come from? You may find this hard to believe, but this figure emerged by mistake. A pretty major thing to make a mistake about, but that’s what happened.
Also on rt.com Up to 90% of people who test positive for Covid barely carry any virus & are not contagious. Every stat about the disease is bogus
Such things occur. On September 23, 1998, NASA permanently lost contact with the Mars Climate Orbiter. It was supposed to go round and round the planet looking at the weather, but instead it hit Mars at around 5,000 mph, exploding into tiny fragments. It didn’t measure the weather; it became the weather – for a few seconds anyway.
An investigation later found that the disaster happened because engineers had used the wrong units. They didn’t convert pound seconds into Newton seconds when doing their calculations. Imperial, not metric. This, remember, was NASA. An organisation not completely full of numbskulls.
Now you and I probably have no idea of the difference between a pound second and a Newton second (it’s 0.67 – I looked it up). But you would kind-of hope NASA would. In fact, I am sure they do, but they didn’t notice, so the figures came out wrong. The initial mistake was made, and was baked into the figures.
Kaboom!
With Covid, a similar mistake happened. One type of fatality rate was substituted for another. The wrong rate was then used to predict the likely death rate – and, as with NASA, no-one picked up the error.
In order to understand what happened, you have to understand the difference between two medical terms that sound the same – but are completely different. Rather like a pound second or a Newton second.
Which fatality rate, did you say?
First, there’s the Infection Fatality Rate (IFR). This is the total number of people who are infected by a disease and the number of them who die. This figure includes those who have no symptoms at all, or only very mild symptoms – those who stayed at home, coughed a bit and watched Outbreak.
Then there’s the Case Fatality Rate (CFR). This is the number of people suffering serious symptoms, who are probably ill enough to be in hospital. Clearly, people who are seriously ill – the “cases” – are going to have a higher mortality rate than those who are infected, many of whom don’t have symptoms. Put simply – all cases are infections, but not all infections are cases.
Which means that the CFR will always be far higher than the IFR. With influenza, the CFR is around ten times as high as the IFR. Covid seems to have a similar proportion.
Now, clearly, you do not want to get these figures mixed up. By doing so you would either wildly overestimate, or wildly underestimate, the impact of Covid. But mix these figures up, they did.
The error started in America, but didn’t end there. In healthcare, the US is very much the dog that wags the tail. The figures they come up with are used globally.
On February 28, 2020, an editorial was released by the National Institute of Allergy and Infectious Diseases and the Centers for Disease Control and Prevention (CDC). Published in the New England Journal of Medicine, the editorial stated: “… the overall clinical consequences of Covid-19 may ultimately be more akin to those of a severe seasonal influenza.”
Also on rt.com ‘Corona World’ game backed by German public TV dehumanizes lockdown resisters & kids – but sure, what could go wrong?
They added that influenza has a CFR of approximately 0.1 percent. One person in a thousand who gets it badly, dies.
But that quoted CFR for influenza was ten times too low – they meant to say the IFR, the Infection Fatality Rate, for influenza was 0.1 percent. This was their fatal – quite literally – mistake.
The mistake was compounded. On March 11, the same experts testified to Congress, stating that Covid’s CFR was likely to be about one percent, so one person dying from a hundred who fell seriously ill. Which, as time has passed, has proved to be pretty accurate.
At this meeting, they compared the likely impact of Covid to flu. But they used the wrong CFR for influenza, the one stated in the previous NEJM editorial. 0.1 percent, or one in a thousand. The one that was ten times too low.
Flu toll 1,000 – Covid toll 10,000
So, they matched up the one percent CFR of Covid with the incorrect 0.1 percent CFR of flu. Suddenly, Covid was going to be ten times as deadly.
READ MORE: Lockdown supporters are using psychology pseudoscience to label anti-maskers as irrational, stupid sociopaths
If influenza killed 50, Covid was going to kill 500. If influenza killed a million, Covid was going to get 10 million. No wonder Congress, then the world, panicked. Because they were told Covid was going to be ten times worse than influenza. They could see three million deaths in the US alone, and 70 million around the world.
I don’t expect you or I to get this sort of thing right. But I bloody well expect the experts to do so. They didn’t. They got their IFR and CFR mixed up and multiplied the likely impact of Covid by a factor of ten.
Here’s what the paper, “Public health lessons learned from biases in coronavirus mortality overestimation”,says: “On March 11, 2020,... based on the data available at the time, Congress was informed that the estimated mortality rate for the coronavirus was ten-times higher than for seasonal influenza, which helped launch a campaign of social distancing, organizational and business lockdowns, and shelter-in-place orders.”
On February 28 it was estimated that Covid was going to have about the same impact as a bad influenza season – almost certainly correct. Eleven days later, the same group of experts predicted that the mortality rate was going to be ten times as high. This was horribly, catastrophically, running-into-Mars-at-5,000-miles-an-hour wrong.
Enter the Mad Modellers of Lockdown
In the UK, the group I call the Mad Modellers of lockdown, the Imperial College experts, created the same panic. On March 16, they used an estimated IFR of 0.9 percent to predict that, without lockdown, Covid would kill around 500,000 in the UK.
Is this prediction anywhere close?
So far, the UK has had around 40,000 Covid deaths. Significantly less than 0.1 percent, but not that far off. Of course, people will say... “We had lockdown... without it so many more would have died. Most people have not been infected…” etc.
To answer this, we need to know the true IFR. Is it a 0.1 percent, or one percent? If it is one percent, we have more than 400,000 deaths to go. If it is 0.1 percent, this epidemic has run its course. For this year, at least.
With swine flu, remember that the IFR started at around two percent. In the end, it was 0.02 percent, which was five times lower than the lowest estimate during the outbreak. The more you test, the lower the IFR will fall.
Also on rt.com We might have to wait forever for science to show the Covid threat is over, so let’s use our common sense & get back to normal
So where can we look to get the current figures on the IFR? The best place to look is at the country that has tested more people than anywhere else as a proportion of their population: Iceland.
As of last week, Iceland’s IFR stood at 0.16 per cent. It cannot go up from here. It can only fall. People can’t start dying of a disease they haven’t got.
This means that we’ll probably end up with an IFR of about 0.1 percent, maybe less. Not the 0.02 percent of Swine Flu – somewhere between the two, perhaps. In short, the 0.1 percent prophecy has proved to be pretty much bang on.
Which means that we’ve had all the deaths we were ever going to get. And which also means that lockdown achieved, almost precisely nothing with regard to Covid. No deaths were prevented.
Mangled beyond recognition
Yes, we are testing and testing, and finding more so-called cases. As you will. But the hospitals and ICUs are virtually empty. Almost no-one is dying of Covid anymore, and most of those who do were otherwise very ill.
Instead of celebrating that, we’ve artificially created a whole new thing to scare ourselves with. We now call a positive test a Covid “case.” This is not medicine. A “case” is someone who has symptoms. A case is not someone carrying tiny amounts of virus in their nose.
Now, however, you test positive, and you’re a “case.” Never in history has medical terminology been so badly mangled. Never have statistics been so badly mangled.
READ MORE: Weird science: Covid-19 does NOT cause heart damage, as blockbuster study had basic calculation errors
When researchers look back at this pandemic, they’ll have absolutely no idea who died because of Covid, or who died –coincidentally– with it. Everything’s been mashed together in a determined effort to make the virus look as deadly as possible.
Lockdown happened because we were told that Coivid could kill one percent. But Covid was never going to kill more than about 0.1 percent – max.
That’s the figure estimated back in February, by the major players in viral epidemiology. A figure that has turned out to be remarkably accurate. Bright guys… bad mistake.
We’ve killed tens of thousands – for nothing
But because we panicked, we’ve added hugely to the toll. Excess mortality between March and May was around 70,000, not the 40,000 who died of/with Covid. Which means 30,000 may have died directly as a result of the actions we took.
We protected the young, the children, who are at zero risk of Covid. But we threw our elderly and vulnerable under a bus. The very group who should have been shielded. Instead, we caused 20,000 excess deaths in care homes.
It was government policy to clear out hospitals, and stuff care homes with patients carrying Covid, or discharge them back to their own homes, to infect their nearest and dearest. Or any community care staff who visited them.
We threw – to use health secretary Matt Hancock’s ridiculous phrase – a ring of steel around care homes. As it turned out, this was not to protect them, but to trap the residents, as we turned their buildings into Covid incubators. Anyone working in care homes, as I do, knows why we got 20,000 excess deaths. Government policy did this.
That is far from all the damage. On top of care homes, the ONS estimates that 16,000 excess deaths were caused by lockdown. The heart attacks and strokes that were not treated. The empty, echoing hospitals and A&E units. The cancer treatments stopped entirely.
Which means that at least as many people have died as a result of the draconian actions taken to combat Covid, as have been killed by the virus itself. This has been a slow-motion stampede, where the elderly – in particular - were trampled to death.
We locked down in fear. We killed tens of thousands unnecessarily, in fear. We crippled the economy, and left millions in fear of their livelihoods. We have trapped abused women and children at home with their abusers. We have wiped out scores of companies, and crushed entire industries.
We stripped out the NHS, and left millions in prolonged pain and suffering, on ever lengthening waiting lists, which have doubled. There have also been tens of thousands of delayed cancer diagnoses – the effects of which are yet to be seen, but the Lancet has estimated at least sixty thousand years of life will be lost.
Lockdown can be seen as a complete and utter disaster. And it was all based on a nonsense, a claim that Covid was going to kill one percent. A claim that can now be seen to be utterly and completely wrong. Sweden, which did not lock down, has had a death rate of 0.0058 percent.
It takes a very big person to admit they have made a horrible, terrible mistake. But a horrible, terrible mistake has been made. Let’s end this ridiculous nonsense now. And vow never to let such monumental stupidity happen ever again.
https://www.rt.com/op-ed/500000-covid19 ... ake-panic/
-
Belligerent Savant
- Posts: 5624
- Joined: Mon Oct 05, 2009 11:58 pm
- Location: North Atlantic.
Re: Coronavirus Crisis: Main Thread
.
Somewhat interesting 'sync': I only came across this Dr's website (below) after conniption posted his RT article above, and yet his commentary echoes mine (albeit with far more detail than my 'one-off' observations). Haven't performed due diligence on this author, so the standard caveat lector applies, but for now, his words are worthy of sharing here.
This author's reasoning for this wild variance in numbers is due to 'miscalculation', essentially. I'd like to believe that -- if the lower numbers for death rate turn out to be as accurate as indicated -- it was purely due to getting the math wrong. But I'm more cynical than that, for good reason.
There was intent here, in my view. Let's see if I'm eventually proven wrong.
https://drmalcolmkendrick.org/2020/09/0 ... y-matters/
Belligerent Savant » Sat Sep 05, 2020 12:59 pm wrote:.
"cases". How many of these "cases" are asymptomatic or minimally symptomatic vs. more serious symptoms? I'd like to see such metrics, if they even exist.
[side-bar: to what extent do these numbers -- the tally of "cases" -- account for false-positives?]
This is a question for anyone out there.
Somewhat interesting 'sync': I only came across this Dr's website (below) after conniption posted his RT article above, and yet his commentary echoes mine (albeit with far more detail than my 'one-off' observations). Haven't performed due diligence on this author, so the standard caveat lector applies, but for now, his words are worthy of sharing here.
This author's reasoning for this wild variance in numbers is due to 'miscalculation', essentially. I'd like to believe that -- if the lower numbers for death rate turn out to be as accurate as indicated -- it was purely due to getting the math wrong. But I'm more cynical than that, for good reason.
There was intent here, in my view. Let's see if I'm eventually proven wrong.
https://drmalcolmkendrick.org/2020/09/0 ... y-matters/
COVID – why terminology really, really matters
[And the consequences of getting it horribly wrong]
When is a case not a case?
Since the start of the COVID pandemic I have watched almost everyone get mission critical things wrong. In some ways this is not surprising. Medical terminology is horribly imprecise, and often poorly understood. In calmer times such things are only of interest to research geeks like me. Were they talking about CVD, or CHD?
However, right now, it really, really, matters. Specifically, with regards to the term COVID ‘cases.’
Every day we are informed of a worrying rise in COVID cases in country after country, region after region, city after city. Portugal, France, Leicester, Bolton. Panic, lockdown, quarantine. In France the number of reported cases is now as high as it was at the peak of the epidemic. Over 5,000, on the first of September.
But what does this actually mean? Just to keep the focus on France for a moment. On March 26th, just before their deaths peaked, there were 3,900 hundred ‘cases’. Fourteen days later, there were 1,400 deaths. So, using a widely accepted figure, which is a delay of around two weeks between diagnoses and death, 36% of cases died.
In stark contrast, on August 16th, there were 3,000 cases. Fourteen days later there were 26 deaths. Which means that, in March, 36% of ‘cases’ died. In August 0.8% of ‘cases’ died. This, in turn, means that COVID was 45 times as deadly in March, as it was in August?
This seems extremely unlikely. In fact, it is so unlikely that it is, in fact, complete rubbish. What we have is a combination of nonsense figures which, added together, create nonsense squared. Or nonsense to the power ten.
To start with, we have the mangling of the concept of a ‘case’.
Previously, in the world of infectious diseases, it has been accepted that a ‘case’ represents someone with symptoms, usually severe symptoms, usually severe enough to be admitted to hospital. Here, from Wikipedia…. yes, I know, but on this sort of stuff they are a good resource.
Note the word symptomatic i.e. someone with symptoms.‘In epidemiology, a case fatality rate (CFR) — sometimes called case fatality risk or disease lethality — is the proportion of deaths from a certain disease compared to the total number of symptomatic people diagnosed with the disease.’ 1
However, now we stick a swab up someone’s nose, who feels completely well, or very mildly ill. We find that they have some COVID particles lodged up there, and we call them a case of COVID.
A symptomless, or even mildly symptomatic positive swab is not a case. Never, in recorded history, has this been true. However, now we have an almost unquestioned acceptance that a positive swab represents a case of COVID. This is then parroted on all the news channels as if it were gospel.
I note that, at last, some people are beginning to question how it can be that, whilst cases are going up and up, deaths are going down, and down.
This is even the case in Sweden, which seems to be the final bastion of people with functioning brains. However, even they seem surprised by this dichotomy. In the first two weeks of August they had 4,152 positive swabs. Yet, in the last two weeks of August, they had a mere 14 deaths (one a day, on average).
That represents 1 death for every 300 positive swabs or, as the mainstream media insists on calling them, positive ‘cases’. Which, currently, represent a case fatality rate of 0.33%. Just to compare that with something similar, the case fatality rate of swine flu (HIN1), was 0.5%. 2
Thus, lo and behold, COVID is a less severe infection than swine flu – the pandemic that never was. That’s what these figures appear to tell us. They tell us almost exactly the same in France where they ‘appear’ to have a current case fatality rate of 0.4%.
On the other hand, if you look at the figures from around the world, they are very different. As I write this there have been, according to the WHO, 25 million cases and 850,000 deaths. That is a case fatality rate of more than 3%. Ten times as high.
Why are these figures so all over the place? It is because we are using horribly inaccurate terminology. We are comparing apples with pomegranates to tell us how many bananas we have. Our experts are, essentially, talking gibberish, and the mainstream media is lapping it up. They are defining asymptomatic swabs as cases, and no-one is calling them out on it. Why?
Because… because they are frightened of looking stupid? Primarily, I believe, because they also have no idea what a case might actually be So, it all sounds quite reasonable to them.
The good news
However, moving on from that nonsense, there is some extremely good news buried in here. Which I am going to try and explain. It goes as follows.
At the start of the epidemic, the only people being tested were those who were being admitted to hospital, who were seriously ill. Many of them died. Which is why, in France, there was this very sharp, initial case fatality rate of 35%. In the UK the initial case fatality rate was I think 14%. Last time I looked at the UK figures, the case fatality was 5%, and falling fast.
This fall has occurred, and will occur everywhere in the World, because as you increase your testing, you pick up more and more people with less severe symptoms. People who are far less likely to die. The more you test, the more the case fatality rate falls.
It falls even more dramatically when you start to test people who have no symptoms at all. In fact, as you broaden your testing net, something else very important happens. You gradually move from looking at the case fatality rate to the infection fatality rate.
The infection fatality rate is the measure of how many people who are infected [even those without symptoms, or very mild symptoms] who then die. This is the critical figure to know because it gives you an accurate assessment of the total number of deaths you are likely to see.
IFR x population of a country x % of population infected = total number of deaths (total mortality)
Although the case fatality rate in the UK still currently stands at 5%, because it is dragged up by the 14% rate we had at the start, if we look at the more recent figures things have changed very dramatically.
In the first two weeks of August there were 13,996 positive swabs in the UK. In the second two weeks of August there were 129 deaths. If you consider every positive swab to be a case, this represents a case fatality rate of 0.9%. Around one fifteenth of that seen at the start.
I think you can clearly see a direction of travel here.
At the start on the pandemic we had a, brief, 35% fatality rate in France
It was 14% in the UK at the start
It now sits at 5% in the UK – over the whole pandemic
In August, in the UK, it was down to 0.9%
It is currently 0.47% in Germany
It is currently 0.4% in France
It is currently 0.33% in Sweden
It is falling, falling, everywhere. Where does it end up, this hybrid case/infection fatality rate? Remember, we are still only testing a fraction of the population, so we are missing the majority of people who have been infected, mainly those who do not have symptoms. Which means that these rates must fall further, as they always do in any pandemic.
To quote the Centre for Evidence Base Medicine on the matter:
‘In Swine flu, the IFR (infection fatality rate) ended up as 0.02%, fivefold less than the lowest estimate during the outbreak (the lowest estimate was 0.1% in the 1st ten weeks of the outbreak).’ 3
The best place to estimate where we may finally end up with COVID, is with the country that has tested the most people, per head of population. This is Iceland. To quote the Centre for Evidence Based Medicine once more:
‘In Iceland, where the most testing per capita has occurred, the IFR lies somewhere between 0.03% and 0.28%.’ 3
Sitting in the middle of 0.03% and 0.28% is 0.16%. As you can see, Iceland, having tested more people than anywhere else, has the lowest IFR of all. This is not a coincidence. This is an inevitable result of testing more people.
I am going to make a prediction that, in the end, we will end up with an IFR of somewhere around 0.1%. Which is about the same as severe flu pandemics we have had in the past. Remember that figure. It is one in a thousand.
It may surprise you to know that I am not the only person to have made this exact same prediction. On the 28th February, yes that far back, the New England Journal of Medicine published a report by the National Institute of Allergy and Infectious Diseases, National Institutes of Health, Bethesda, MD (A.S.F., H.C.L.); and the Centers for Disease Control and Prevention, Atlanta. 4
In this paper ‘Covid-19 — Navigating the Uncharted’ they stated the following:
A case fatality rate considerably less than 1%. Their words, not mine. As they also added, ‘the overall clinical consequences of Covid-19 may ultimately be more akin to those of a severe seasonal influenza.’‘On the basis of a case definition requiring a diagnosis of pneumonia, the currently reported case fatality rate is approximately 2%. In another article in the Journal, Guan et al. report mortality of 1.4% among 1099 patients with laboratory-confirmed Covid-19; these patients had a wide spectrum of disease severity. If one assumes that the number of asymptomatic or minimally symptomatic cases is several times as high as the number of reported cases, the case fatality rate (my underline) may be considerably less than 1%. This suggests that the overall clinical consequences of Covid-19 may ultimately be more akin to those of a severe seasonal influenza.’
At this point, you may well be asking. Why the hell did we lockdown if COVID was believed to be no more serious than influenza? Right from the start by the most influential infectious disease organisations in the World.
It is because of the mad mathematical modellers. The academic epidemiologists. Neil Ferguson, and others of his ilk. When they were guessing (sorry estimating, sorry modelling) the impact of COVID they used a figure of approximately one per cent as the infection fatality rate. Not the case fatality rate. In so doing, they overestimated the likely impact of COVID by, at the very least, ten-fold.
How could this possibly have happened?
When they put their carefully constructed model together on the 16th of March, if they had been reading the research, they must have been aware that they were looking at a maximum case fatality rate of just over 1% in China, right at the start, where the figures are always at their highest.
Which means that, unless COVID was going to turn out nearly 100% fatal, we could never get anywhere near 1%, for the infection fatality rate. Even Ebola only kills 50%.
But they went with it, they went with 1%. Actually, Imperial College reduced it slightly to 0.9%, for reasons that are opaque.
From this, all else flowed.
If the INFECTION fatality rate truly were 0.9%, and 80% of the population of the UK became infected, there would have been/could have been, around 500,000 deaths.
0.9% x 80% x 67million = 482,000
LOCKDOWN
However, if the case fatality rate is around 1%, then the infection fatality rate will be about one tenth of this, maybe less. So, we would see around 50,000 deaths, about the same as was seen in previous bad flu pandemics.
DO NOT LOCKDOWN
What Imperial College London did was to use a model that overestimated the infection fatality rate by a factor of ten.
We now know, as the IFR rates of various countries falls and falls, that the Imperial College estimated IFR was completely wrong. The UK, for example, has seen 42,000 deaths so far, which is 0.074% of population. The US has seen about 200,000 deaths 0.053%. Sweden, which did not lockdown down, has seen about 6,000 deaths, which is an infection fatality rate of 0.06%. All three countries are opening up and opening up. Whilst the ‘cases’ are rising and rising, the deaths continue to fall. They are, to all intents and purposes, flatlining.
In Iceland it is around 0.16% and falling. In other words…
Stop panicking – it’s over
Whilst everyone is panicking about the ever-increasing number of cases, we should be celebrating them. They are demonstrating, very clearly, that COVID is far, far, less deadly then was feared. The Infection Fatality Rate is most likely going to end up around 0.1%, not 1%.
So yes, it does seem that ‘the overall clinical consequences of Covid-19 may ultimately be more akin to those of a severe seasonal influenza.’
Wise words, wise words indeed. Words that were written by one Anthony S Fauci on the 28th of February 2020. If you haven’t heard of him, look him up.
Critically though, eleven days after this, he rather blotted his copybook, because he went on to say this “The flu has a mortality rate of 0.1 percent. This (COVID) has a mortality rate of 10 times that. That’s the reason I want to emphasize we have to stay ahead of the game in preventing this.” 5
The mortality rate Dr Fauci? Could it possibly be that he failed to understand that there is no such thing as a mortality rate? Did he mean the case fatality rate, or the infection fatality rate? If he meant the Infection mortality rate of influenza, he was pretty much bang on. If he meant the case fatality rate, he was wrong by a factor of ten.
The reality is that, no matter what Fauci went on to say, severe influenza has a case fatality rate of 1%, and so does COVID. They also have approximately the same infection fatality fate of 0.1%.
It seems that Dr Fauci just got mixed up with the terminology. Because in his Journal article eleven days earlier, he did state… ‘This suggests that the overall clinical consequences of Covid-19 may ultimately be more akin to those of a severe seasonal influenza… [and here is the kicker at the end] (which has a case fatality rate of approximately 0.1%).’
You see, he did say the case fatality rate of influenza was approximately 0.1%. Wrong, wrong, wrong, wrong… wrong.
Oh dear, oh dear, oh dear. With influenza, Dr Fauci, the CDC, his co-authors, the National Institute of Allergy and Infectious Diseases and the National Institutes of Health and the New England Journal of Medicine got case fatality rate and infection fatality rate mixed up with influenza. Easy mistake to make. Could have done it myself. But didn’t.
You want to know where Imperial College London really got their 1% infection fatality rate figure from? It seems clear that they got it from Anthony S Fauci and the New England Journal of Medicine. The highest impact journal in the world – which should have the highest impact proof-readers in the world. But clearly does not.
Imperial College then used this wrong NEJM influenza case fatality rate 0.1%. It seems that they then compared this 0.1% figure to the reported COVID case fatality rate, estimated to be 1% and multiplied the impact of COVID by ten – as you would. As you probably should.
So, we got Lockdown. The US used the Fauci figure and got locked down. The world used that figure and got locked down.
That figure just happens to be ten times too high.
I know it is going to be virtually impossible to walk the world back from having made such a ridiculous, stupid, mistake. There are so many reputations at stake. The entire egg production of the world will be required to supply enough yolk to cover appropriate faces.
Of course, it will be denied, absolutely, vehemently, angrily, that anyone got anything wrong. It will be denied that a simple error, a mix up between case fatality and infection fatality led to this. It will even more forcefully stated that COVID remains a deadly killer disease and that all Governments around the world have done exactly the right thing. The actions were right, the models were correct. We all did the RIGHT thing. Only those who are stupid, or incompetent cannot see it.
When wrong, shout louder, get angry, double-down, attack your critics in any way possible. Accuse them of being anti-vaxx, or something of the sort. Dig for the dirt. ‘How to succeed in politics 101, page one, paragraph one.’
However, just have a look, at the figures. Tell me where they are wrong – if you can. The truth is that this particular Emperor has no clothes on and is, currently, standing bollock naked, right in front of you. Hard to believe, but true.
I would like to thank Ronald B Brown for pointing out this catastrophic error, in his article ‘Public health lessons learned from biases in coronavirus mortality overestimation.’ 6
I had not spotted it. He did. All credit is his. I am simply drawing your attention to what has simply been – probably the biggest single mistake that has ever been made in the history of the world.
1: https://en.wikipedia.org/wiki/Case_fatality_rate
2: https://www.thelancet.com/journals/lani ... %C2%B75%25.
3: https://www.cebm.net/covid-19/global-co ... ity-rates/
4: https://www.nejm.org/doi/full/10.1056/nejme2002387
5: https://reason.com/2020/03/11/covid-19- ... ony-fauci/
6: https://www.cambridge.org/core/journals ... BB28DCC6E9
-
liminalOyster
- Posts: 1892
- Joined: Thu May 05, 2016 10:28 pm
- spambot: no
Re: Coronavirus Crisis: Main Thread
IMO this guy's a huckster in the same way that many all-caps ANTIVAXXXXERS!!! are. Meaning, he's on-point in some of what he says but he's chosen a narrative tack that would have you think he's a lone truth teller in a sea of unified conformist non-thought.Belligerent Savant » Mon Sep 07, 2020 12:16 pm wrote:Somewhat interesting 'sync': I only came across this Dr's website (below) after conniption posted his RT article above, and yet his commentary echoes mine (albeit with far more detail than my 'one-off' obseevations). Haven't performed due diligence on this author, so the standard caveat lector applies, but for now, his words are worthy of sharing here.
This author's reasoning for this wild variance in numbers is due to 'miscalculation', essentially. I'd like to believe that -- if the lower numbers for death rate turn out to be as accurate as indicated -- it was purely due to getting the math wrong. But I'm more cynical than that, for good reason.
There was intent here, in my view. Let's see if I'm eventually proven wrong.
https://drmalcolmkendrick.org/2020/09/0 ... y-matters/
By 2008 when his other book appears to have out ("The Great Cholesterol Con") -- a takedown of statins and the basic understanding of cholesterol's role in cardiac illness -- his basic thesis was already largely common opinion among several docs I know. His other book appears similar, lots of generalized wisdom (eg maybe animal fat's not so bad for you, etc) presented as highly controversial and having been suppressed by a kind of unified opposing body of power who he is at odds with. That trick is, IMO, always a red flag.
IOW, he writes in a very yellow way and, IMHO, it's super unhelpful (or maybe just for me personally, as someone who's very interested in reading quite broad opinions and interpretations of ) for COVID data.
ps. Tangential sidenote, but a very smart friend who's not an Off-Guardian reader pointed out to me the other day that the Guardian chose the two most unflattering pix of Graeber to accompany his obit and posthumous articles about him, presumably still miffed about his support for Corbyn, etc.
"It's not rocket surgery." - Elvis