Moderators: Elvis, DrVolin, Jeff
![]() by stickdog99 » Fri Jan 20, 2023 6:19 pm
by stickdog99 » Fri Jan 20, 2023 6:19 pm
![]() by Joe Hillshoist » Sat Jan 21, 2023 12:56 am
by Joe Hillshoist » Sat Jan 21, 2023 12:56 am
![]() by Gnomad » Sat Jan 21, 2023 1:20 am
by Gnomad » Sat Jan 21, 2023 1:20 am
Utrecht is made up of a historic city center, scenic canals are lined with shops and restaurants and bike paths and roads weave through the downtown making it really easy to ship, commute to work or school, and to visit museums or parks without ever using a car.
That's because the city built specialized roads and bike parking facilities to give bicycle riders the upper hand over cars. According to CityLab, cars make up only 15 percent of the trips into the downtown area. Sixty percent are done by cyclists.
There is a new state-of-the-art bicycle 6,000 space parking garage that is located underneath the Utrecht central train station. The spaces will double in the next two years because of demand. Commuters can ride from home directly into the parking facility and then walk just a few minutes to catch a train.
Roads that were built for cars have been redesigned to give cyclists priority and parks and public spaces are being built around the bicycle routes. The Dafne Schippersburg is a multi-use bridge/path that uses the roof of an elementary school as its foundation. The bridge connects the Leidsche Rijn area with the city center.
“You really have the idea that people are the boss of the city, not the machines,” Lott van Hooijdonk, the city’s vice mayor, said in the film.
But the city wasn't always this bicycle friendly. In the 1950s and 60s, cities in the Netherlands were as automotive friendly as cities in the rest of Europe and the US. In the 1970s, in response to a rise in the number of children getting killed in traffic accidents people started protesting against the use of the streets being prioritized for cars according to CityLab. Add the high cost of gasoline and the environmental movement and you have perfect storm conditions for change.
The Netherlands changed directions and started to change city centers into places for bicycle riding, walking and mass transit instead of private automobiles. Today, 98 percent of all households in Utrecht own at least one bicycle. The film states that half own three or more bicycles. Altogether, there are 22.5 billion bicycles in the Netherlands or 1.3 bicycles per household beating out even Denmark.
The transition didn't come cheap. According to the New York Times, the city spends over €49 million or $55 million annually to build, improve and maintain the bike-based transportation network which the city plans on doubling by 2030. There are complaints by car owners that they are being discriminated against and by cyclists that say there aren't enough parking spaces, but these are just growing pains.
The advantages of the changes far outnumber the disadvantages and include reduced air pollution, lower healthcare costs and a host of other social benefits. Plus, the number of deaths of cyclists and pedestrians in traffic accidents has plummeted according to CityLab. In Utrecht, two wheels are so much better than four.
![]() by stickdog99 » Sat Jan 21, 2023 10:27 pm
by stickdog99 » Sat Jan 21, 2023 10:27 pm
![]() by Grizzly » Sun Jan 22, 2023 1:36 am
by Grizzly » Sun Jan 22, 2023 1:36 am


![]() by Gnomad » Sun Jan 22, 2023 4:01 am
by Gnomad » Sun Jan 22, 2023 4:01 am
stickdog99 » Sun Jan 22, 2023 5:27 am wrote:LOL that it is not climate lockdown if the government tells you that are not allowed to use your car because of climate concerns.
And LOL on the doublespeak about how nobody is claiming to be infallible or to know for certain, but also if you dare to question the inflexible "temperatures always follow co2 levels by exactly 50 years" direness of any of their infallible model projections, you are contemptible anti-science climate denier who is not a critical thinker but instead an oppositional thinker.
And right after the COVID projections of what would happen within a few months were proven so false. You can't have it both ways. You can't claim that nobody is claiming these dire projections are infallible while also deeming anyone who dares to question these projections or to point out any cases in which past projections have not panned out a heretical pariah.
And I am not a fucking true believer in anything except the obvious limits of the ability of humans to project the future of systems of near infinite complexity. You know, like Earthly or solar weather. Or the likely outcome of continually vaccinating billions in the middle of a raging pandemic.
CLAIM: The county of Oxfordshire, England, which includes the city of Oxford, is imposing a “climate lockdown” that will confine residents to their neighborhoods.
AP’S ASSESSMENT: False. Oxfordshire has approved a plan to put “traffic filters” on some main roads, restricting drivers’ access during daytime hours and freeing up space for buses, cyclists and pedestrians. But car owners can apply for daylong permits to bypass the new rules, and many other vehicles are exempt. All parts of the county will remain accessible by car, officials said.
THE FACTS:Last week, local leaders in Oxfordshire voted to try a new traffic reduction system in an effort to reduce congestion in the county’s namesake city. Some on social media have since likened the scheme to stringent government COVID-19 containment policies.
“UK. - Oxfordshire Council, part of the 15 minute city club, has passed a plan to trial a Climate lockdown,” tweeted one user, alongside a screenshot of an article warning that “residents will be confined to their local neighbourhood.”
The plan “would control movements in a gated city, allowing only 100 car journeys in & out per car & monitoring all movements,” the tweet continued. “Did you vote for this?”
“Next up: Climate lockdown trials,” wrote another Twitter user, sharing a screenshot of the article.
But Oxfordshire’s “traffic filters” will not block access to any part of the city of Oxford or the rest of the county, let alone lock people in their neighborhoods, the county government told The Associated Press.
“Everywhere in the city will still be accessible by car,” Paul Smith, spokesperson for the Oxfordshire County Council, wrote in an email. “Nobody will need permission from the county council to drive or leave their home.”
The “traffic filters” are license plate recognition cameras, not physical barriers. From 7 a.m. to 7 p.m., drivers in private cars will be automatically fined if they cross through the filters without a permit. Motorists who live in Oxford will be able to apply for 100 daylong permits to drive through the filters per year.
The “15 minute city club” referenced by one of the misleading tweets is an unrelated urban planning framework under which city residents would ideally be able to reach essential services within a 15-minute walk or bike ride from their home. Officials with the city of Oxford have separately proposed pursuing these goals. But some on social media have incorrectly linked the two, suggesting the traffic rules will also bar residents from leaving their neighborhoods.
The city and county emphasized in a joint statementthat the traffic restrictions will not “be used to confine people” to a given area. “Everyone can go through all the filters at any time by bus, bike, taxi, scooter or walking,” the statement added.
Oxford councillors receive deluge of death threats over climate 'lockdown' conspiracy
The council has been sent a photograph of a noose and councillors have been compared to Nazis.
It is claimed by the council's detractors that the city of Oxford was to be divided into "zones", which residents would be prevented from leaving, in order to combat climate change.
Calls, email and social media messages are flooding into the council, decrying the "lockdown" plot from local leaders.
The conspiracy emerged after Oxford County Council approved a trial scheme, costing £6.5million, preventing motorists from using particular routes at particular times.
The scheme, which will be in place for six-months during a trial period, is aimed at reducing the number of unnecessary journeys in the congested city and enable buses to travel more easily.
![]() by Gnomad » Sun Jan 22, 2023 4:07 am
by Gnomad » Sun Jan 22, 2023 4:07 am
Grizzly » Sun Jan 22, 2023 8:36 am wrote:Canada performing more organ transplants from MAID donors than any country in the world
https://www.ctvnews.ca/health/canada-performing-more-organ-transplants-from-maid-donors-than-any-country-in-the-world-1.6234133?cid=sm%3Atrueanthem%3A%7B%7Bcampaignname%7D%7D%3Atwitterpost%E2%80%8B&taid=63c6e484e2457e0001a588ef&utm_campaign=trueAnthem%3A+Trending+Content&utm_medium=trueAnthem&utm_source=twitter
![]() by PufPuf93 » Mon Jan 23, 2023 3:05 pm
by PufPuf93 » Mon Jan 23, 2023 3:05 pm
Belligerent Savant » Fri Jan 13, 2023 3:55 pm wrote:.DrEvil » Fri Jan 13, 2023 1:28 pm wrote:It's a constant source of bafflement to me how people, often the ones who claim to think for themselves and routinely call others sheep, have gobbled up the oil industry propaganda so thoroughly. Even now, when climate change is glaringly obvious, they're desperately clinging to their narratives.
King of misrepresentation/mischaracterization.
No one here is swallowing 'oil industry propaganda'. I can understand how you can see it that way, of course, but needless to say it doesn't make it true.
You also continue to conflate questioning the extent of climate change with questioning the actual causes for climage change -- perhaps you're dense, perhaps you're too caught up in your own curated intake.
Climate change is not the key contention here. The questions raised repeatedly by me over the past year or so on this thread are (to repeat) primarily as follows:
What are the primary drivers of the current cycle of any climate change, and to what extent is everyday human consumption (of various forms of fuel/energy) truly a primary factor (as opposed to large-scale industry/elite-level consumption of gas/oil as a primary driver) for whatever change is actually occurring? What else, besides anthropogenic factors, can be contributing to any change (and are these non-human factors more involved than advertised in any change occurring over time), and are the solutions proposed by dominant narratives, such as solar, wind, and electricity, truly as 'clean' as advertised, and can they be efficient at scale and developed without significant use of gas and oil?
And: to what extent are the same/similar vile operators responsible for the egregious affronts over the last 2 years in particular (and far longer, historically) utilizing current mainstream programming on 'climate change' for their own greedy/power-hungry/ill-intentioned gains at the expense of the many rubes and plebes that go right along with the narratives with minimal, if any, discernment (not to mention all those that get pulled down with all the rubes and are negatively impacted by disastrous policy changes or 'initiatives')?
Notice there are no absolutes above.
These questions have yet to receive compelling replies, or have been simply ignored.
This blindly accepted notion that carbon dioxide is absolutely a key contributor to whatever climate change may actually be occurring is simply foolish. Even in mainstream circles this is in contention.Environmental Protection Agency Administrator Scott Pruitt said Thursday he does not believe carbon dioxide is a primary contributor to global warming.
"I think that measuring with precision human activity on the climate is something very challenging to do and there's tremendous disagreement about the degree of impact, so no, I would not agree that it's a primary contributor to the global warming that we see," he told CNBC's "Squawk Box."
https://www.cnbc.com/2017/03/09/epa-chi ... ruitt.html

![]() by DrEvil » Mon Jan 23, 2023 6:56 pm
by DrEvil » Mon Jan 23, 2023 6:56 pm

![]() by DrEvil » Mon Jan 23, 2023 7:12 pm
by DrEvil » Mon Jan 23, 2023 7:12 pm
Grizzly » Sun Jan 22, 2023 7:36 am wrote:Canada performing more organ transplants from MAID donors than any country in the world
https://www.ctvnews.ca/health/canada-performing-more-organ-transplants-from-maid-donors-than-any-country-in-the-world-1.6234133?cid=sm%3Atrueanthem%3A%7B%7Bcampaignname%7D%7D%3Atwitterpost%E2%80%8B&taid=63c6e484e2457e0001a588ef&utm_campaign=trueAnthem%3A+Trending+Content&utm_medium=trueAnthem&utm_source=twitter
![]() by Elvis » Mon Jan 23, 2023 9:36 pm
by Elvis » Mon Jan 23, 2023 9:36 pm

![]() by Belligerent Savant » Tue Jan 24, 2023 2:38 am
by Belligerent Savant » Tue Jan 24, 2023 2:38 am
"I think that measuring with precision human activity on the climate is something very challenging to do and there's tremendous disagreement about the degree of impact, so no, I would not agree that it's a primary contributor to the global warming that we see," he told CNBC's "Squawk Box."
Despite pandemic shutdowns, carbon dioxide and methane surged in 2020
Levels of the two most important anthropogenic greenhouse gases, carbon dioxide and methane, continued their unrelenting rise in 2020 despite the economic slowdown caused by the coronavirus pandemic response, NOAA announced today.
The global surface average for carbon dioxide (CO2), calculated from measurements collected at NOAA’s remote sampling locations, was 412.5 parts per million (ppm) in 2020, rising by 2.6 ppm during the year. The global rate of increase was the fifth-highest in NOAA’s 63-year record, following 1987, 1998, 2015 and 2016. The annual mean at NOAA's Mauna Loa Observatory in Hawaii was 414.4 ppm during 2020.
...
Analysis of samples from 2020 also showed a significant jump in the atmospheric burden of methane, which is far less abundant but 28 times more potent than CO2 at trapping heat over a 100-year time frame. NOAA’s preliminary analysis showed the annual increase in atmospheric methane for 2020 was 14.7 parts per billion (ppb), which is the largest annual increase recorded since systematic measurements began in 1983. The global average burden of methane for December 2020, the last month for which data has been analyzed, was 1892.3 ppb. That would represent an increase of about 119 ppb, or 6 percent, since 2000.
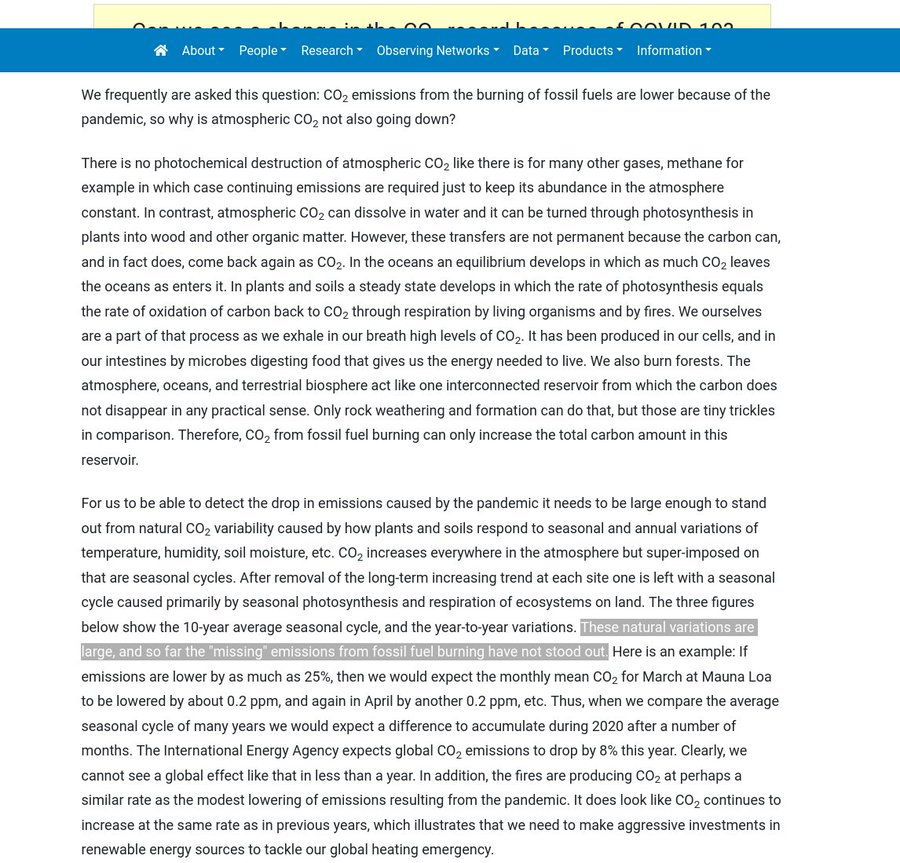
A Climate Conundrum: Why Didn’t Atmospheric CO2 Fall During the Pandemic?
During the COVID-19 pandemic, carbon dioxide increased at the same rate in the atmosphere despite lower emissions, say researchers from campus and JPL; plus, what is good for ozone reduction is bad for methane removal.
A comprehensive new survey of the COVID-19 pandemic’s effects on the atmosphere that uses satellite data from NASA and other international space agencies offers insights into addressing the dual threats of climate warming and air pollution.
“We’re past the point where we can think of these as two separate problems,” says Joshua Laughner, lead author of the study and a former postdoctoral fellow in the Division of Geological and Planetary Sciences who now works at JPL, which Caltech manages for NASA. “To understand what is driving changes to the atmosphere, we must consider how air quality and climate influence each other.”
Published in November 2021 in the Proceedings of the National Academy of Sciences, the paper developed out of a workshop sponsored by the W. M. Keck Institute for Space Studies and led by scientists on campus and at JPL. The COVID-19 pandemic and resulting limitations put on travel and other economic sectors by countries around the globe drastically decreased air pollution and greenhouse gas emissions within just a few weeks. However, while carbon dioxide (CO2) emissions fell by 5.4 percent in 2020 compared to the previous year, the amount of carbon dioxide in the atmosphere continued to grow at about the same rate as in preceding years. While the drop in emissions was significant, the growth in atmospheric concentrations of CO2 was within the normal range of year-to-year variation caused by natural processes. Also, the ocean did not absorb as much carbon dioxide from the atmosphere as it has in recent years, probably due to the reduced pressure of carbon dioxide in the air at the ocean’s surface.
Published: 13 July 2022
Coupled stratosphere-troposphere-Atlantic multidecadal oscillation and its importance for near-future climate projection
Nour-Eddine Omrani, Noel Keenlyside, Katja Matthes, Lina Boljka, Davide Zanchettin, Johann H. Jungclaus & Sandro W. Lubis
npj
Climate and Atmospheric Science volume 5, Article number: 59 (2022)
Abstract
Northern Hemisphere (NH) climate has experienced various coherent wintertime multidecadal climate trends in stratosphere, troposphere, ocean, and cryosphere. However, the overall mechanistic framework linking these trends is not well established. Here we show, using long-term transient forced coupled climate simulation, that large parts of the coherent NH-multidecadal changes can be understood within a damped coupled stratosphere/troposphere/ocean-oscillation framework. Wave-induced downward propagating positive stratosphere/troposphere-coupled Northern Annular Mode (NAM) and associated stratospheric cooling initiate delayed thermohaline strengthening of Atlantic overturning circulation and extratropical Atlantic-gyres. These increase the poleward oceanic heat transport leading to Arctic sea-ice melting, Arctic warming amplification, and large-scale Atlantic warming, which in turn initiates wave-induced downward propagating negative NAM and stratospheric warming and therefore reverse the oscillation phase. This coupled variability improves the performance of statistical models, which project further weakening of North Atlantic Oscillation, North Atlantic cooling and hiatus in wintertime North Atlantic-Arctic sea-ice and global surface temperature just like the 1950s–1970s.
Ron Clutz
Montreal, Canada
Ron Clutz has more than 30 years experience leading projects analyzing and transforming organizational processes and structures. Ron has designed and administered change management programs involving small groups of executives, as well as organizational interventions involving several hundred people. He has given seminars and lectures and has written manuals and articles on task-group leadership and on strategic planning. As a KPMG partner until 1997 he led that firm's work in Organizational Effectiveness
Temps Cause CO2 Changes, Not the Reverse.
2022 Update
Update March 23, 2022
For a possible explanation of natural warming and CO2 emissions see: Little Ice Age Warming Recovery May be Over
This post is about proving that CO2 changes in response to temperature changes, not the other way around, as is often claimed. In order to do that we need two datasets: one for measurements of changes in atmospheric CO2 concentrations over time and one for estimates of Global Mean Temperature changes over time.
Climate science is unsettling because past data are not fixed, but change later on. I ran into this previously and now again in 2021 and 2022 when I set out to update an analysis done in 2014 by Jeremy Shiers (discussed in a previous post reprinted at the end). Jeremy provided a spreadsheet in his essay Murray Salby Showed CO2 Follows Temperature Now You Can Too posted in January 2014. I downloaded his spreadsheet intending to bring the analysis up to the present to see if the results hold up. The two sources of data were:
Temperature anomalies from RSS here: http://www.remss.com/missions/amsu
CO2 monthly levels from NOAA (Mauna Loa): https://www.esrl.noaa.gov/gmd/ccgg/trends/data.html
Changes in CO2 (ΔCO2)
Uploading the CO2 dataset showed that many numbers had changed (why?).
The blue line shows annual observed differences in monthly values year over year, e.g. June 2020 minus June 2019 etc. The first 12 months (1979) provide the observed starting values from which differentials are calculated. The orange line shows those CO2 values changed slightly in the 2020 dataset vs. the 2014 dataset, on average +0.035 ppm. But there is no pattern or trend added, and deviations vary randomly between + and -. So last year I took the 2020 dataset to replace the older one for updating the analysis.
Now I find the NOAA dataset in 2021 has almost completely new values due to a method shift in February 2021, requiring a recalibration of all previous measurements. The new picture of ΔCO2 is graphed below.
The method shift is reported at a NOAA Global Monitoring Laboratory webpage, Carbon Dioxide (CO2) WMO Scale, with a justification for the difference between X2007 results and the new results from X2019 now in force. The orange line shows that the shift has resulted in higher values, especially early on and a general slightly increasing trend over time. However, these are small variations at the decimal level on values 340 and above. Further, the graph shows that yearly differentials month by month are virtually the same as before. Thus I redid the analysis with the new values.
Global Temperature Anomalies (ΔTemp)
The other time series was the record of global temperature anomalies according to RSS. The current RSS dataset is not at all the same as the past.
....
Tonnes of Toxic Solar Panels Already Headed For A Landfill Near You
January 20, 2023 by stopthesethings
Solar panels were meant to be all sunshine and lollipops, with nothing but tingly virtuous feelings for their subsidised owners. With an effective economic lifespan of little more than a decade – after 12 years in service their output is nothing like their original capacity and at the 15-year mark, it becomes a pointless fraction, especially if they’re not cleaned on a very regular basis. Which is the reason why millions of panels are already being crushed and dumped in landfills, with millions more to follow.
Got a landfill in your neighbourhood? Well it’s probably time to do some homework on what is being dumped there.
Solar panels are a veritable toxic cocktail of gallium arsenide, tellurium, silver, crystalline silicon, lead, cadmium and other heavy metals. Ground up and dumped in their millions into landfills, it’s not difficult to imagine the effect on water supplies, the environment and human health as their poisonous entrails leach into the water table over the coming centuries.
John Droz helps rain on the ‘solar can do no wrong’ parade, below.
Solar Realities
Election Integrity
John Droz
13 December 2022
Part 1 – Summary of Solar Energy Concerns
Let’s step back, put aside the marketing hype, and look at some of the key consequences of promoting and subsidizing industrial solar energy:
Solar projects rarely have meaningful state rules or regulations to abide by (note: a similar situation also exists for another current political favorite: wind energy);
Solar lobbyists often attempt to further handicap local communities from enacting meaningful regulations, by advocating an expedited approval process;
Solar projects require 100% backup, so we must pay for twice the energy sources;
Solar projects require 100% backup, which is typically from gas, so that needs to be factored in when discussing cost, environmental impact, CO2 reduction, etc.;
Solar facilities are likely a net energy sink (e.g., see this study);
When a comprehensive and objective financial analysis is done, solar is 5x± the cost of conventional electrical energy sources (e.g., here, here, here, here & here);
Despite states shelling out Billions of dollars to benefit the solar industry, no scientific, thorough, objective studies have shown that solar is a net benefit. See this 2021 Study: Built Solar Facilities are Chronically Underperforming;
Solar has a high potential for substantial environmental harm, like polluting
aquifers with carcinogens (e.g., here, here, here, here and here) [also see Part 2];
Solar will likely reduce nearby home values (e.g., here, here, and here);
Solar can take prime farmland out of production (e.g., here), which results in loss of jobs, loss of farm equipment & supplies sold, and a loss of consumer produce;
Solar facilities with batteries can be a major hazard (e.g., here and here);
Solar facilities can be problematic to nearby airports (e.g., FAA, study and study);
Solar results in an enormous toxic disposal problem for the state (e.g., here, here, here, and here) — who will pay for that and where are the state rules about this?
Solar has no scientifically-proven consequential net reduction of climate change! In fact, some studies (e.g., here, here, here, here, here and here) conclude that there’s good evidence that solar facilities make climate change worse; and
Going solar likely benefits Communist China (e.g., here here, and here).’
Some additional sample relevant information about solar energy:
Uncle Sam’s Solar Racket — a Cesspool of Waste and Corruption
Wind and Solar Are Intermittent and Incapable of Meeting Our Needs
Why Wind and Solar Energy are Doomed to Failure
Surprising Disadvantages of Using Solar Energy
Leaders Hopelessly Misguided on Wind and Solar Power
Study: The More Solar on the Grid, the Less Value it Has
Cost Comparison: Actual Nuclear vs Solar Facilities
Part 2 – Solar Panel Toxicity Overview
When potential solar project host communities ask solar developers what toxic materials are in their solar panels, they typically say that they are not aware of any.
Although that may seem evasive, it may be an accurate response as:
most solar panels come from China,
China does not have anywhere near the environmental concern that we do, and
Chinese suppliers are unlikely to divulge negative information about their products.
The takeaway is: buyer beware. In other words, potential host communities for industrial solar facilities should be aware of what we do know — and then act accordingly to fully protect their community.
So what DO we know? We know that these are some of the toxic (some carcinogenic) chemicals that have been identified as likely being in solar panels (click on the links to get an idea of what some of the adverse health consequences are):
Per- and Polyfluoroalkyl Substances (PFAs) (also see here and here)
Perfluorooctane sulphonate (PFOS)
Polytetrafluoroethylene (PTFE)
Fluorinated Ethylene (FEP)
Cadmium Telluride
Copper Indium Selenide
Cadmium Gallium diselenide
Copper Indium Gallium diselenide
Silicon Tetrachloride
Hexafluoroethane
Polyvinyl Fluoride
Also, here is a basic explanation of the silicon manufacturing part of solar panels. The following are some additional toxic chemicals that have been identified as possibly being involved in the fabrication of solar panels, which might end up in the finished product:
Hydrogen chloride
Silicon tetrachloride
Hydrochloric acid
Sulfuric acid
Nitric acid
Sulfuric acid
Polycyclic aromatic hydrocarbons
Formaldehyde
Arsine gas
Trichlorosilane gas
Silane gas
Sulfur dioxide
Sulfur hexaflouride
Sodium hydroxide
Potassium hydroxide
Lead
Now that they have been alerted to the severity of the solar panel toxicity issue, what do conscientious states and communities do to protect their citizens and eco-systems from these life-threatening chemicals?
With solar, there are two major concerns with these toxic materials:
Over the 20± year estimated life of solar panels, how do states and local communities make sure that these chemicals will not migrate from solar panels into soils and local aquifers? and
How will solar panels with these materials be safely disposed of at the end of their useful life, and who will pay for it?(Note: these panels will not biodegrade, plus it is extremely difficult to recycle very much of these panels.)
The answers to both questions should primarily be found in state laws, and secondarily in local ordinances.
It is unconscionable to have state legislators mandate solar projects (e.g., via Renewable Portfolio Standards [RPS] legislation), yet not likewise pass accompanying appropriate legislation to protect their citizens (and environment) from the well-documented toxic threats that can result from their RPS.
Additionally, for state legislators to throw the responsibility of protecting citizens and the environment onto the backs of local representatives, is beyond unreasonable. In North Carolina, for example, what sense does it make to require that a hundred counties must get educated on the impacts of these toxic materials, and then write (and pass) a hundred local ordinances that try to address that threat to their communities?
Election Integrity
Another Mining Truth Bomb from John Lee Pettimore - EVs Are Anything But "Green"
EV Mandates Are Absurd
Ok, lets talk about EVs. How much mining is required to make an EV battery? Lithium brines typically contain less than 0.1% lithium, so that entails some 25,000 pounds of brines to get the 25 pounds of pure lithium needed to fabricate a single battery. #GreenEnergy
Cobalt ore grades average about 0.1%, thus nearly 30,000 pounds of ore.
Nickel ore grades average about 1%, thus about 6,000 pounds of ore.
Graphite ore is typically 10%, thus about 1,000 pounds per battery.
Copper at about 0.6% in the ore, thus about 25,000 pounds of ore per battery.
In total then, acquiring just these five elements to produce the 1,000-pound EV battery requires mining about 90,000 pounds of ore.
But before we get to any of that ore we must remove the overburden. What is overburden? Its the dirt/rock we must remove to get to the ore body.
Overburden ranges from about 3 to 20 tons of earth removed to access each ton of ore. This means that accessing about 90,000 pounds of ore requires digging and moving between 200,000 and over 1,500,000 pounds of earth or about 500,000 pounds per battery.
Great now that we are into the ore body now what? Now we have to haul it, crush it, run it through ball mills and chemicals in order to get the final product. This is a picture of typical ball mills used to further crush the rock.
Before we begin the mining process we need drills, shovels, haul trucks, support equipment explosives and manpower. Millions of gallons of fuel, oils and coolants, because without these there is no #GreenEnergy mining.
Analyses show that manufacturing a single battery, one capable of holding energy that is equivalent to one barrel of oil, entails processes that use the energy equivalent of 100 barrels of oil.
And if the batteries are manufactured in Asia (as 60% of the world’s batteries are now), more than 60% of the electricity to do so is coal-fired. In 2022, China produced a record amount of coal at 4.496 billion tonnes, which is nine percent more than the year before.
Non-battery, electrical systems in an EV use some 300% more overall copper compared with a conventional automobile. How much more mining do we have to do for that?John Lee Pettimore
@JohnLeePettim13
I get a lot of replies on my tweets, "Make mining Green" Energy consumption of mining is 6.2% of the total global energy consumption. The annual global energy consumption is 580 million terajoules or the energy equivalent of a Hiroshima nuclear bomb going off every four seconds.@JohnLeePettim13
Renewable energy is expected to grow from 2-6% of global primary energy use by 2030, but in order for that to happen we must mine more, a lot more.
7:23 PM · Jan 19, 2023@JohnLeePettim13
48,500 active haul trucks (over 90 tons) at surface mines worldwide. The cost to run each truck on average is $500 per hr. $582,000,000 spent every 24 hours worldwide to operate these trucks. Each truck gets approx. 1/2 a mile per gal. You cant make #GreenEnergy without mining.Linda Marie Lovison
@lilo623
Replying to @DameScorpio and @JBillLevy
"A single Tesla battery weighing 1,000 pounds requires extracting and processing some 500,000 pounds of materials. At this rate, over the next thirty years we will need to mine more mineral ores than humans have extracted over the last 70,000 years."
@JohnLeePettim13
#GreenEnergy

![]() by Gnomad » Tue Jan 24, 2023 2:46 am
by Gnomad » Tue Jan 24, 2023 2:46 am
Gnomad » Sun Jan 22, 2023 11:07 am wrote:Grizzly » Sun Jan 22, 2023 8:36 am wrote:Canada performing more organ transplants from MAID donors than any country in the world
https://www.ctvnews.ca/health/canada-performing-more-organ-transplants-from-maid-donors-than-any-country-in-the-world-1.6234133?cid=sm%3Atrueanthem%3A%7B%7Bcampaignname%7D%7D%3Atwitterpost%E2%80%8B&taid=63c6e484e2457e0001a588ef&utm_campaign=trueAnthem%3A+Trending+Content&utm_medium=trueAnthem&utm_source=twitter
That is pretty damning shit.
When did they first start doing assisted death? Is this a new development?
![]() by stickdog99 » Tue Jan 24, 2023 3:37 am
by stickdog99 » Tue Jan 24, 2023 3:37 am
SHAME, SHAME!
You quoted the disgusting views of a disgusting "human activity is destroying the climate denying" Republican!
SHAME, SHAME!
What were you thinking?
SHAME, SHAME!
![]() by Gnomad » Tue Jan 24, 2023 4:46 am
by Gnomad » Tue Jan 24, 2023 4:46 am
The 2022 melt season in Greenland overall (April 1 to October 31) had a cumulative total of 22.1 million square kilometers (8.53 million square miles) of melt, placing it at nineteenth highest in the 43-year satellite record (Figure 1b). While this is 18.1 million square kilometers (6.99 million square miles) above the 1981 to 2010 average, it is below the average for the twenty-first century years of 2001 to 2022 by 26.3 million square kilometers (10.2 million square miles). Though recent years have not reached or exceeded the extreme melting totals of 2010, 2012, or 2016, the past two decades continue to have consistently more melting than earlier years.
This set record warm conditions and unprecedented surface melt extents through the month relative to the 40+ year satellite record. In most years, the September cumulative melt area totals do not exceed 1 million square kilometers (386,000 square miles). The 1981 to 2010 average is 486,000 square kilometers (188,000 square miles). By contrast, the 2022 cumulative melt area total was 3.9 million square kilometers (1.51 million square miles), more than doubling the previous record September melt. The record September prior to 2022 was 2010, with 1.6 million square kilometers (618,000 square miles).
(meaning the amount of water lost from the ice would cover that area - aka banana for scale)According to new satellite data compiled by Polar Portal (opens in new tab), a collection of four Danish government research institutions, Greenland has lost more than 5,100 billion tons (4,700 billion metric tons) of ice in the past 20 years — or roughly enough to flood the entire United States in 1.6 feet (0.5 meters) of water.
The runaway collapse of the West Antarctic Ice Sheet—which would trigger catastrophic sea level rise—is not "inevitable", scientists said Monday following research that tracked the region's recent response to climate change.
As global temperatures rise, there is mounting concern that warming could trigger so-called tipping points that set off irreversible melting of the world's massive ice sheets and ultimately lift oceans enough to drastically redraw the world map.
New research published Monday suggests a complex interaction of factors affecting the melting of the West Antarctic Ice Sheet, which is home to the enormous and unstable Pine Island and Thwaites glaciers—nicknamed the "Doomsday glacier"—that together could raise global sea levels by more than three meters (10 feet).
Using satellite imagery as well as ocean and climate records between 2003 and 2015, an international team of researchers found that while the West Antarctic Ice Sheet continued to retreat, the pace of ice loss slowed across a vulnerable region of the coastline.
Their study, published in the journal Nature Communications, concluded that this slowdown was caused by changes in ocean temperatures that were caused by offshore winds, with pronounced differences in the impact depending on the region.
Researchers said that this raises questions about how rising temperatures will affect the Antarctic, with ocean and atmospheric conditions playing a key role.
"That means that ice-sheet collapse is not inevitable," said co-author Professor Eric Steig from the University of Washington in Seattle.
"It depends on how climate changes over the next few decades, which we could influence in a positive way by reducing greenhouse gas emissions."
The researchers observed that while in one region, in the Bellingshausen Sea, the pace of ice retreat accelerated after 2003, it slowed in the Amundsen Sea.
'Blink of an eye'
They concluded that this was down to changes in the strength and direction of offshore surface winds, which can change the ocean currents and disturb the layer of cold water around Antarctica and flush relatively warmer water towards the ice.
Both the North and South pole regions have warmed by roughly three degrees Celsius compared to late 19th-century levels, nearly three times the global average.
Users browsing this forum: No registered users and 12 guests